
Stablecoinomics (noun) /ˌsteɪbəlˈkɔɪnɒmɪks/ is the branch of economics that studies how stablecoins are issued and circulated in digital economies.
1. Stablecoin Functions
1.1. Overview
A stablecoin is a blockchain-based financial instrument designed to maintain a fungible, divisible, and price-stable unit of account while functioning simultaneously as a medium of exchange, a medium of credit, and a store of value. Stablecoins are typically backed by and redeemable for underlying collateral such as cash or cash-equivalent assets, which serve as the reference asset anchoring the token’s denomination and intrinsic value.
- Unit of account means prices, contracts, and debts can be denominated in the stablecoin, making it a reference unit for economic activity.
- Fungibility means each unit of the stablecoin is interchangeable with any other unit of the same denomination.
- Divisibility means the stablecoin can be divided into smaller units without losing proportional value.
- Medium of exchange means the stablecoin can be used to make payments, settle transactions, and transfer value between parties.
- Medium of credit means the stablecoin can be lent and borrowed to create debt.
- Store of value means the stablecoin can preserve and potentially grow its purchasing power over time.
- Blockchain-based means the stablecoin is issued on a network that utilizes distributed ledger technology (DLT) to structure data as cryptographically linked blocks of transactions validated through trustless consensus across the internet.
1.2. Price Stability
A stablecoin’s price stability is determined by how closely its market price tracks the value of its reference asset, typically a fiat currency. While market prices are influenced by external forces such as liquidity and trading activity, they ultimately reflect market confidence in the stablecoin’s collateral backing, credibility, and redeemability.
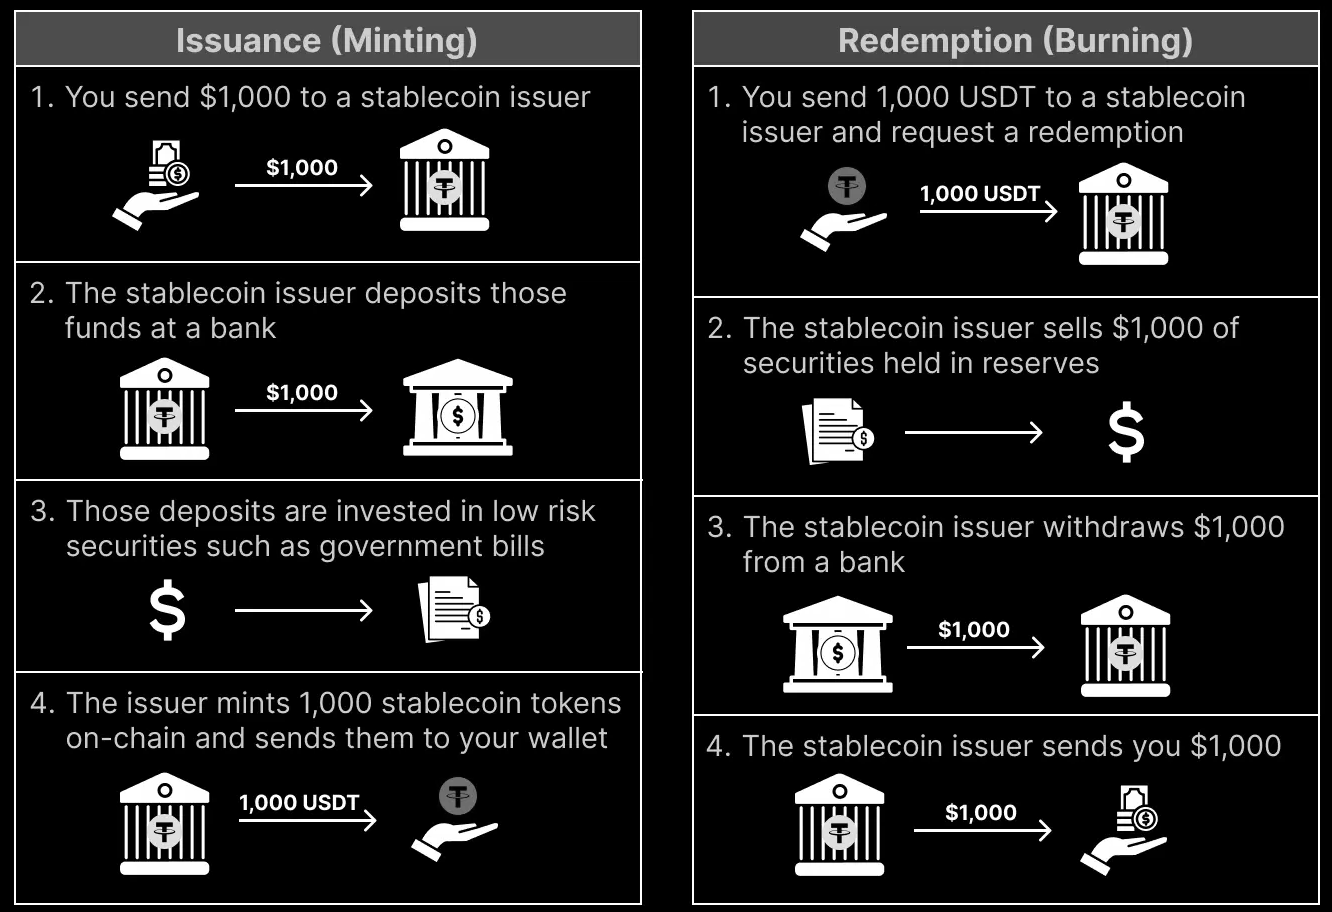
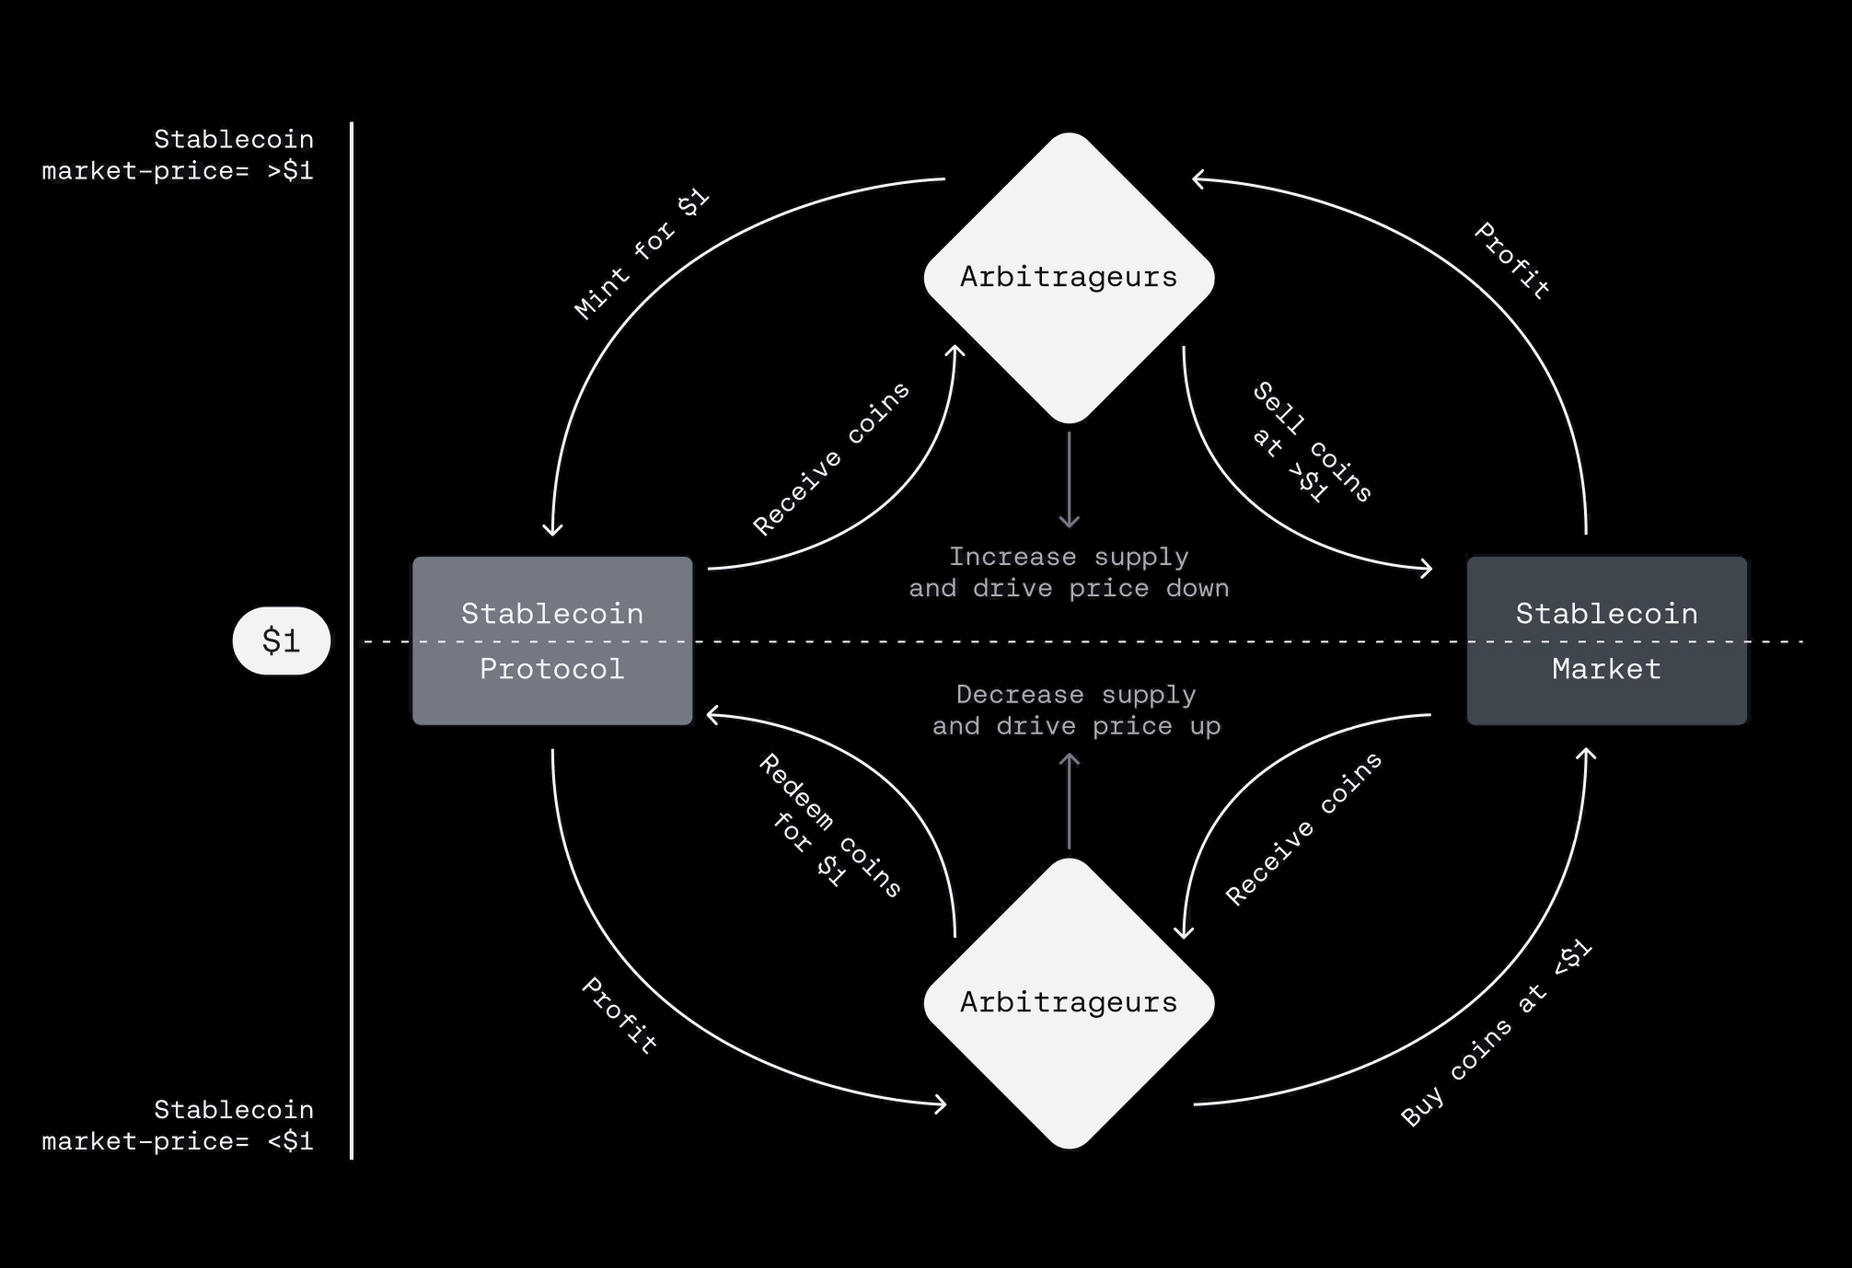
Most stablecoins are pegged to and backed by the US dollar. When users mint and redeem stablecoins on a 1:1 basis directly with the issuer, a hard peg is established at $1. That redemption mechanism allows market makers and arbitrageurs to maintain a soft peg on exchanges, keeping the token’s price close to its reference value.
If there is low arbitrage activity in the secondary market, the stablecoin issuer could potentially intervene with open market operations, similar to central banks. In doing so, it temporarily takes on the arbitrageur role to support market liquidity and peg stability directly.
Stablecoin Peg Classification
Hard Peg (Primary Market) | Soft Peg (Secondary Market) | |
Enforcer | Stablecoin issuer | Market participants |
Exchange Rate | Fixed at 1:1 (minus any fees) | Fluctuates around the peg |
Price Stability | Based on collateral integrity and anchored via redemption access | Based on market forces that are influenced by collateral integrity, redemption access, and issuer credibility |
The existence of issuance/redemption fees may cause the stablecoin to deviate from its peg since market participants can price those fees into the token’s exchange rates.
1.3. Benefits
Stablecoins represent a new technological form through which money can circulate with higher velocity in an increasingly digital economy. Much as the 20th century saw the emergence of electronic payment networks and real-time gross settlement (RTGS) systems, blockchain-based financial instruments like stablecoins are now transforming how value is transferred, settled, and integrated across global markets.
Unlike traditional banking rails which depend on centralized intermediaries and limited operating hours, stablecoins operate continuously on decentralized networks that coordinate transactions through distributed ledgers, enabling structural advantages such as:
Borderless Transfers | Stablecoins can be transferred globally between wallets without correspondent banking networks like SWIFT, enabling direct cross-border payments without geographic restrictions |
Near-Instant Settlement | Most stablecoin transactions settle within seconds to a few minutes, compared with 1-3 business days for ACH or longer for international wire transfers |
Low Transaction Fees | Stablecoin transfers often cost less than $1 on many networks or roughly 0.1-0.3% per transaction, compared with 3-5% average fees for cross-border bank transfers |
Self-Custody | Stablecoins can be held directly in user-controlled wallets secured by private keys, allowing individuals and institutions to store and transfer assets without custodial banks |
Global Availability | Anyone with an internet connection and a compatible wallet can access stablecoin networks, expanding financial participation beyond traditional banking infrastructure |
24/7/365 Accessibility | Blockchain networks operate continuously, allowing 24/7/365 stablecoin transfers and settlements without banking hours or settlement cutoffs |
Programmability | Stablecoins can be embedded in smart contracts to automate financial functions such as payments, lending, escrow, and derivatives execution |
Composability | Stablecoins integrate seamlessly with other onchain applications such as lending markets, decentralized exchanges, and other protocols to create modular financial services |
Trustless Consensus | Transactions are validated through decentralized consensus mechanisms rather than trusted intermediaries, removing reliance on centralized clearing institutions |
Onchain Transparency | All stablecoin transactions are recorded on public blockchains where balances and transfers can be independently verified in real time |
Immutable Records | Once confirmed on the blockchain, stablecoin transactions become extremely difficult to alter or reverse, creating a permanent financial record |
Cryptographic Security | Stablecoin ownership and transfers are secured through public-key cryptography, ensuring that only the holder of the private key can authorize transactions |
1.4. Use Cases
Stablecoins currently serve numerous use cases in TradFi (traditional finance), CeFi (centralized finance), and DeFi (decentralized finance):
- In retail contexts, stablecoins enable superior payments and cross-border transfers through a digital equivalent of bank money that’s faster, cheaper, and borderless, yet unconstrained by the traditional banking system. Many users in developing countries also utilize stablecoins as an alternative store of value to hedge against local currency devaluation and inflation risks.
- In business and institutional settings, stablecoins can be used for programmable transactions, global payments/settlement, payroll, treasury operations, and financial market activity to enhance capital efficiency and reduce transactional costs. Merchants who accept stablecoins, for example, can slash payment processing fees by 95% or more compared to traditional methods.
- In both CeFi and DeFi, stablecoins dominate activity across crypto exchanges and decentralized applications, where they function as natural fiat on/off-ramps as well as primary mediums of exchange and stores of value. Stablecoins also power a majority of crypto lending markets and liquidity pools, providing the onchain economy with access to fiat-denominated credit, yield, and liquidity.
- In AI applications, stablecoins enable autonomous transactions between agents, APIs, and blockchain-integrated ecosystems without relying on traditional rails. This makes stablecoins a natural financial primitive for the emerging agentic economy, including M2M (machine-to-machine), M2B (machine-to-business), and M2C (machine-to-consumer).
1.5. Payments vs. Savings
The healthiest monetary systems separate money for spending from money for saving. Payment money optimizes for liquidity, while savings money optimizes for yield. A monetary system becomes impractical when it tries to combine both properties of payment and saving into a single currency.
Stablecoins can function effectively as a medium of exchange and credit because they are inherently non-yield-bearing. When money itself carries yield, spending or borrowing it creates an opportunity cost, which distorts credit pricing and reduces transactional usage, leading to lower velocity over time. For example:
- Traditional savings accounts and money market funds that offer debit or check-writing features still see significantly lower payment usage than non-yield-bearing checking accounts.
- Short sellers who borrow dividend-paying stocks must compensate lenders for owed dividends (i.e., substitute payments) in addition to borrowing costs. This makes dividend stocks more expensive to borrow in general.
- Yieldcoins are more expensive to borrow than stablecoins due to the underlying yield acting as a tax on credit, similar to dividend stocks. Most crypto exchanges also use stablecoins, not yieldcoins, as quote assets.
For users looking to save instead of spending or borrowing money, stablecoins can function separately as a store of value, similar to fiat currencies. They can also be deployed productively in capital markets to generate external yields, allowing users to offset inflation and earn returns on idle capital.
Stablecoin collateral backing may generate yield as well, and some issuers share this internal yield with their users. However, due to regulatory prohibitions on yield-bearing stablecoins across the world, issuers typically do not embed yield accumulation within the token's architecture. Instead, they strip internal yield from the token and distribute it separately to savers, allowing the stablecoin to remain yield-free by itself. As a result, "yield-forwarding" has become a common industry practice. For example:
- Circle shares internal yield from its collateral reserve with users who hold USDC in Coinbase as “stablecoin rewards.” USDC holders outside Coinbase do not receive these rewards.
- Similarly, PayPal distributes rewards to users in certain DeFi protocols, including PYUSD lenders in Morpho. PYUSD holders outside these protocols do not receive rewards.
A few projects also utilize rebasing mechanisms to distribute internal yield to stablecoin holders. Rebasing is a mechanism where the stablecoin’s smart contract automatically adjusts the number of tokens in each wallet to reflect yield accrual. However, rebasing is less common in DeFi because it impairs composability and creates accounting complexity for protocols.
Yield vs. Stablecoin Functionality
Role of Stablecoin | Role of Yield | |
Medium of Exchange | Unit of account for payments, settlement, and pricing goods or services | Negative. Yield discourages spending and reduces money velocity |
Medium of Credit | Unit of account for borrowing and pricing debt | Negative. Yield acts as a tax on borrowing and reduces credit velocity |
Store of Value | Unit of account for savings or growing purchasing power | Positive. Yield compensates for inflation and time value of money |
2. Issuer Economics
2.1. Overview
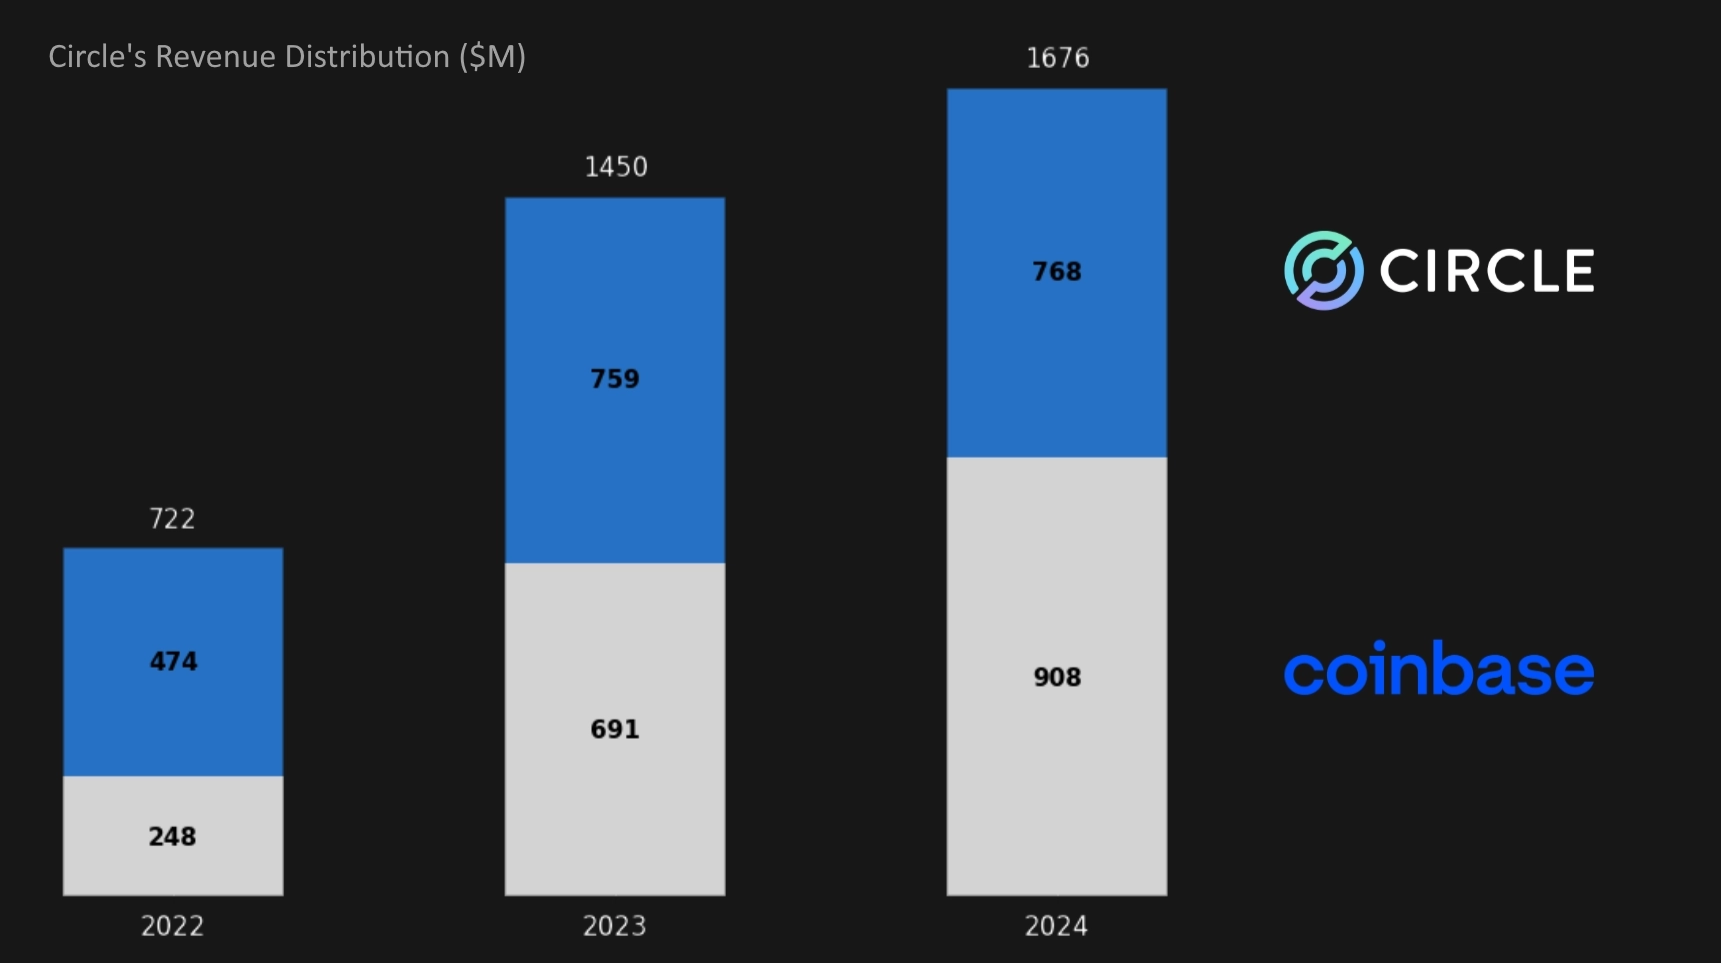
Reserve income, or interest earned on float, remains the primary source of revenue for stablecoin issuers. Circle (USDC), the world’s second largest issuer, generates more than 95% of its revenue from internal yield [1]. Issuers may also charge fees for minting and redeeming tokens, i.e., seigniorage fees. For example, Tether (USDT), the world’s largest issuer, earns 5-10% of its revenue from institutional fees, with 80-90% of revenue coming from reserve income [2]. In practice, however, strong competition and demand for frictionless transactions keep seigniorage close to zero for most stablecoins.
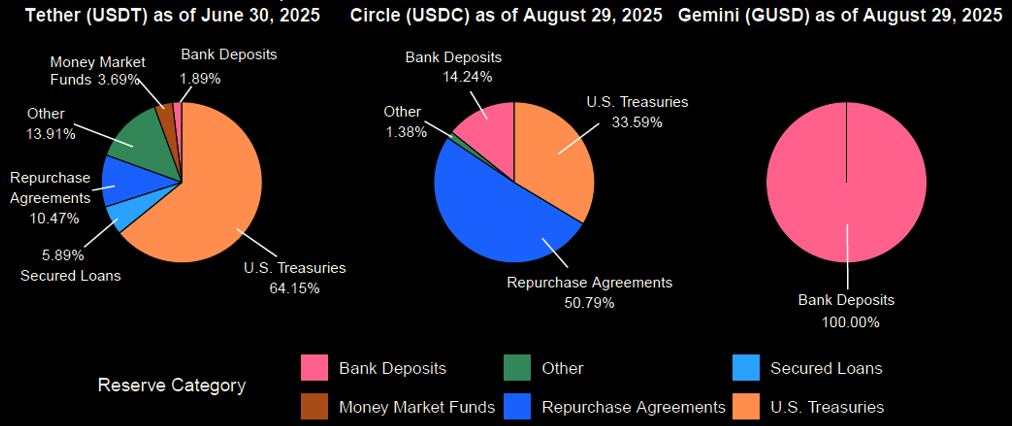
Since current stablecoin regulations only allow issuers to allocate reserves into permitted assets like cash and cash equivalents, including short-term government bonds (e.g., U.S. T-bills), their reserve income is effectively tied to the risk-free rate. During low interest rate environments, reserve income may decline significantly, threatening issuers whose economics depend heavily on interest income. Therefore, regulated stablecoin issuers will need to diversify into adjacent business models, such as payments processing, credit intermediation, or ecosystem services, rather than relying solely on reserve income once short-term rates fall.
Stablecoin Reserve Compositions
Circle’s Revenue Breakdown
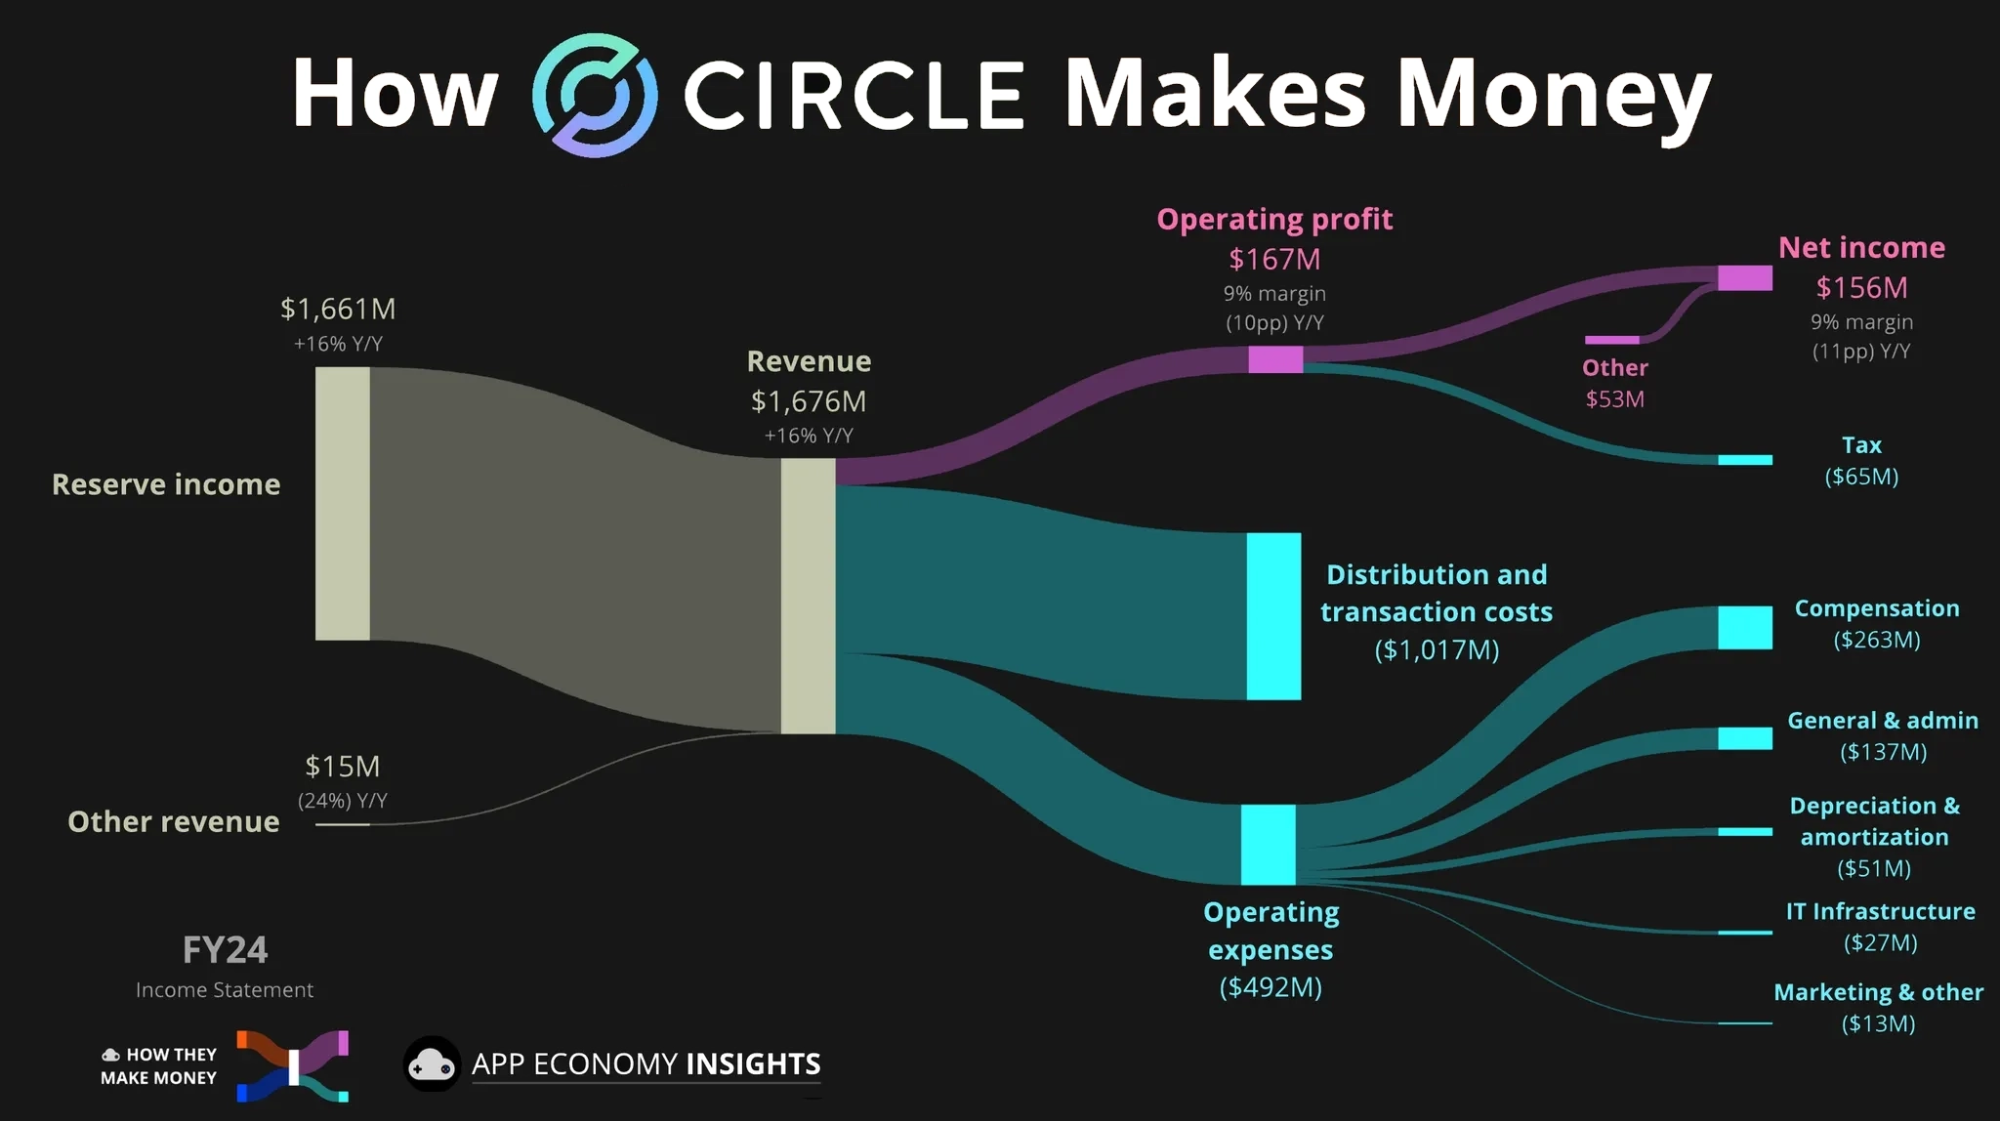
Circle’s Revenue Distribution
2.2. Margin Compression
A stablecoin is like a bank check that lives on blockchain rails. However, banks don't monetize checks directly; many even provide them to customers for free. Stablecoins will eventually follow a similar path as competition increases, forcing issuers to incentivize adoption by externalizing reserve income and reduce seigniorage earnings. Otherwise, they risk losing market share to those who do. In fact, Circle has been doing this since 2023 with Coinbase, its investor, strategic partner, and largest USDC distributor. According to public disclosures, Coinbase receives 50% of reserve income from USDC held on its exchange, along with a share of reserve income from USDC distributed outside Coinbase. Circle records these payments to Coinbase as distribution expenses [3].
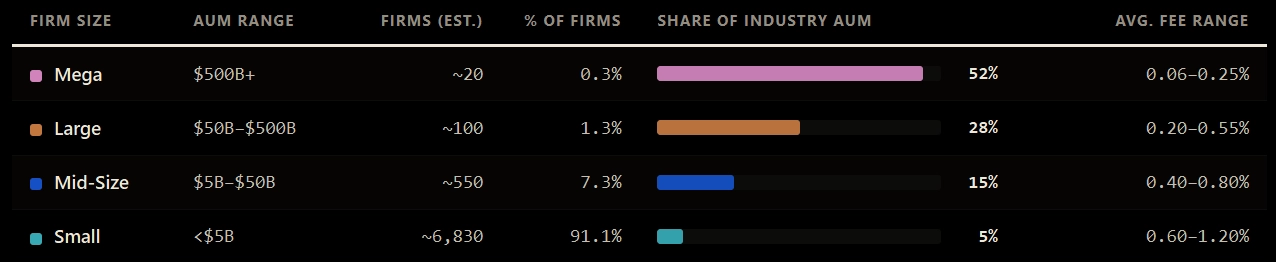
As more reserve income is shared with users and ecosystem partners, regulated stablecoins increasingly compete with more than $100 trillion in global bank deposits [4] while addressing a global payments market exceeding $2 quadrillion in annual volume [5], making distribution scale and network effects as economically important as reserve size. Declining margins from reserve income also resemble historical fee compression in the mutual fund industry, where competition and commoditization have steadily eroded profitability since the introduction of passively-managed funds. As a result, future stablecoin issuers that do not expand into adjacent financial services will need to adopt operationally efficient, low-margin business models similar to modern mutual fund and ETF firms, which collectively manage over $80 trillion in global AUM today [6].
Still, stablecoins remain early in their lifecycle, and their long-term economics will likely evolve over time in response to changing markets, technologies, and regulations.
Global Mutual Fund & ETF Industry Statistics
3. Stablecoin Taxonomy
3.1. Overview
In addition to fiat-backed stablecoins, most of which operate under official regulatory frameworks, there are stablecoins backed by non-fiat assets like crypto, credit positions, delta-neutral strategies, yieldcoins, and/or other stablecoins. The majority of these tokens are unregulated and may also be referred to as “synthetic dollars.”
Stablecoins should be classified based on what actually backs them and how their pegs are enforced, not just surface-level labels. Historically, stablecoin implementations have been anchored by external assets (exogenous), protocol token reflexivity (endogenous), or a hybrid of the two, with each model exhibiting different properties, market dynamics, and risk profiles.
Exogenously-backed stablecoins further fall into three subcategories:
- Reserve-backed stablecoins are issued against a pool of liquid assets held in reserve, either offchain (e.g., cash, T-Bills) or onchain (e.g., yieldcoins, LP tokens). Centralized reserve-backed stablecoins are the most common (e.g., USDT, USDC), but decentralized varieties also exist. Their peg stability is enforced through direct redemption and natural arbitrage forces, ultimately depending on the underlying’s reserve integrity and issuer credibility.
- CDP-backed stablecoins are minted by locking onchain collateral into smart contracts, where minters/borrowers open collateralized debt positions (CDPs). Peg stability depends on over-collateralization, liquidation mechanisms, market confidence in the protocol, as well as arbitrage between debt repayment and token pricing.
- Strategy-backed stablecoins are supported by actively managed or programmatic yield-generating strategies, such as delta-neutral positions or basis trades, with either onchain or offchain collateral custody. Peg stability depends on strategy solvency, collateral integrity, redeemability, market confidence in the strategy/issuer, and arbitrage forces.
3.2. Stablecoin Classification
Exogenously-Backed | Endogenously-Backed | Hybrid | |
Issuance Model | Centralized & permissioned with on/off-chain collateral
Decentralized & permissionless with onchain collateral only | Decentralized & permissionless with onchain collateral | Mixed implementations |
Collateral/Reserve Assets | External assets with independent market value (e.g., bank deposits, T-bills, stablecoins, yieldcoins, crypto, RWA) or market-neutral strategies | Protocol-issued token backed by utility, governance demand, protocol revenue, and/or future growth potential | Mixed implementations |
Collateral/Reserve Ratio | At least 100% if reserve or strategy-backed
Typically 120-150% or more if CDP-backed | 100% backed by utility tokens | Mixed implementations |
Economic Anchor | Collateral, reserve, strategy health, solvency & transparency | Market confidence in the protocol | Mixed implementations |
Peg Stability Mechanisms | Hard peg via redemption (reserve/strategy)
Soft peg via liquidation (CDP) or arbitrage (all) | Mint/burn or supply adjustment against protocol token to maintain a soft peg; relies on reflexive demand | Mixed implementations |
Open Market Operations | Capital-efficient liquidity & secondary peg defense mechanism on top of hard backing. Optional; not required | Short-term liquidity & peg defense mechanism; not sustainable for long-term peg defense. Often a core protocol feature | Mixed implementations |
Key Failure Risk
(Non-Exhaustive) | Collateral, reserve, or strategy impairment | Reflexive death spiral of utility token price | Mixed risks depending implementation |
Examples | LFRAX (backed by FXS & other onchain collateral) |

3.3. dUSD Classification
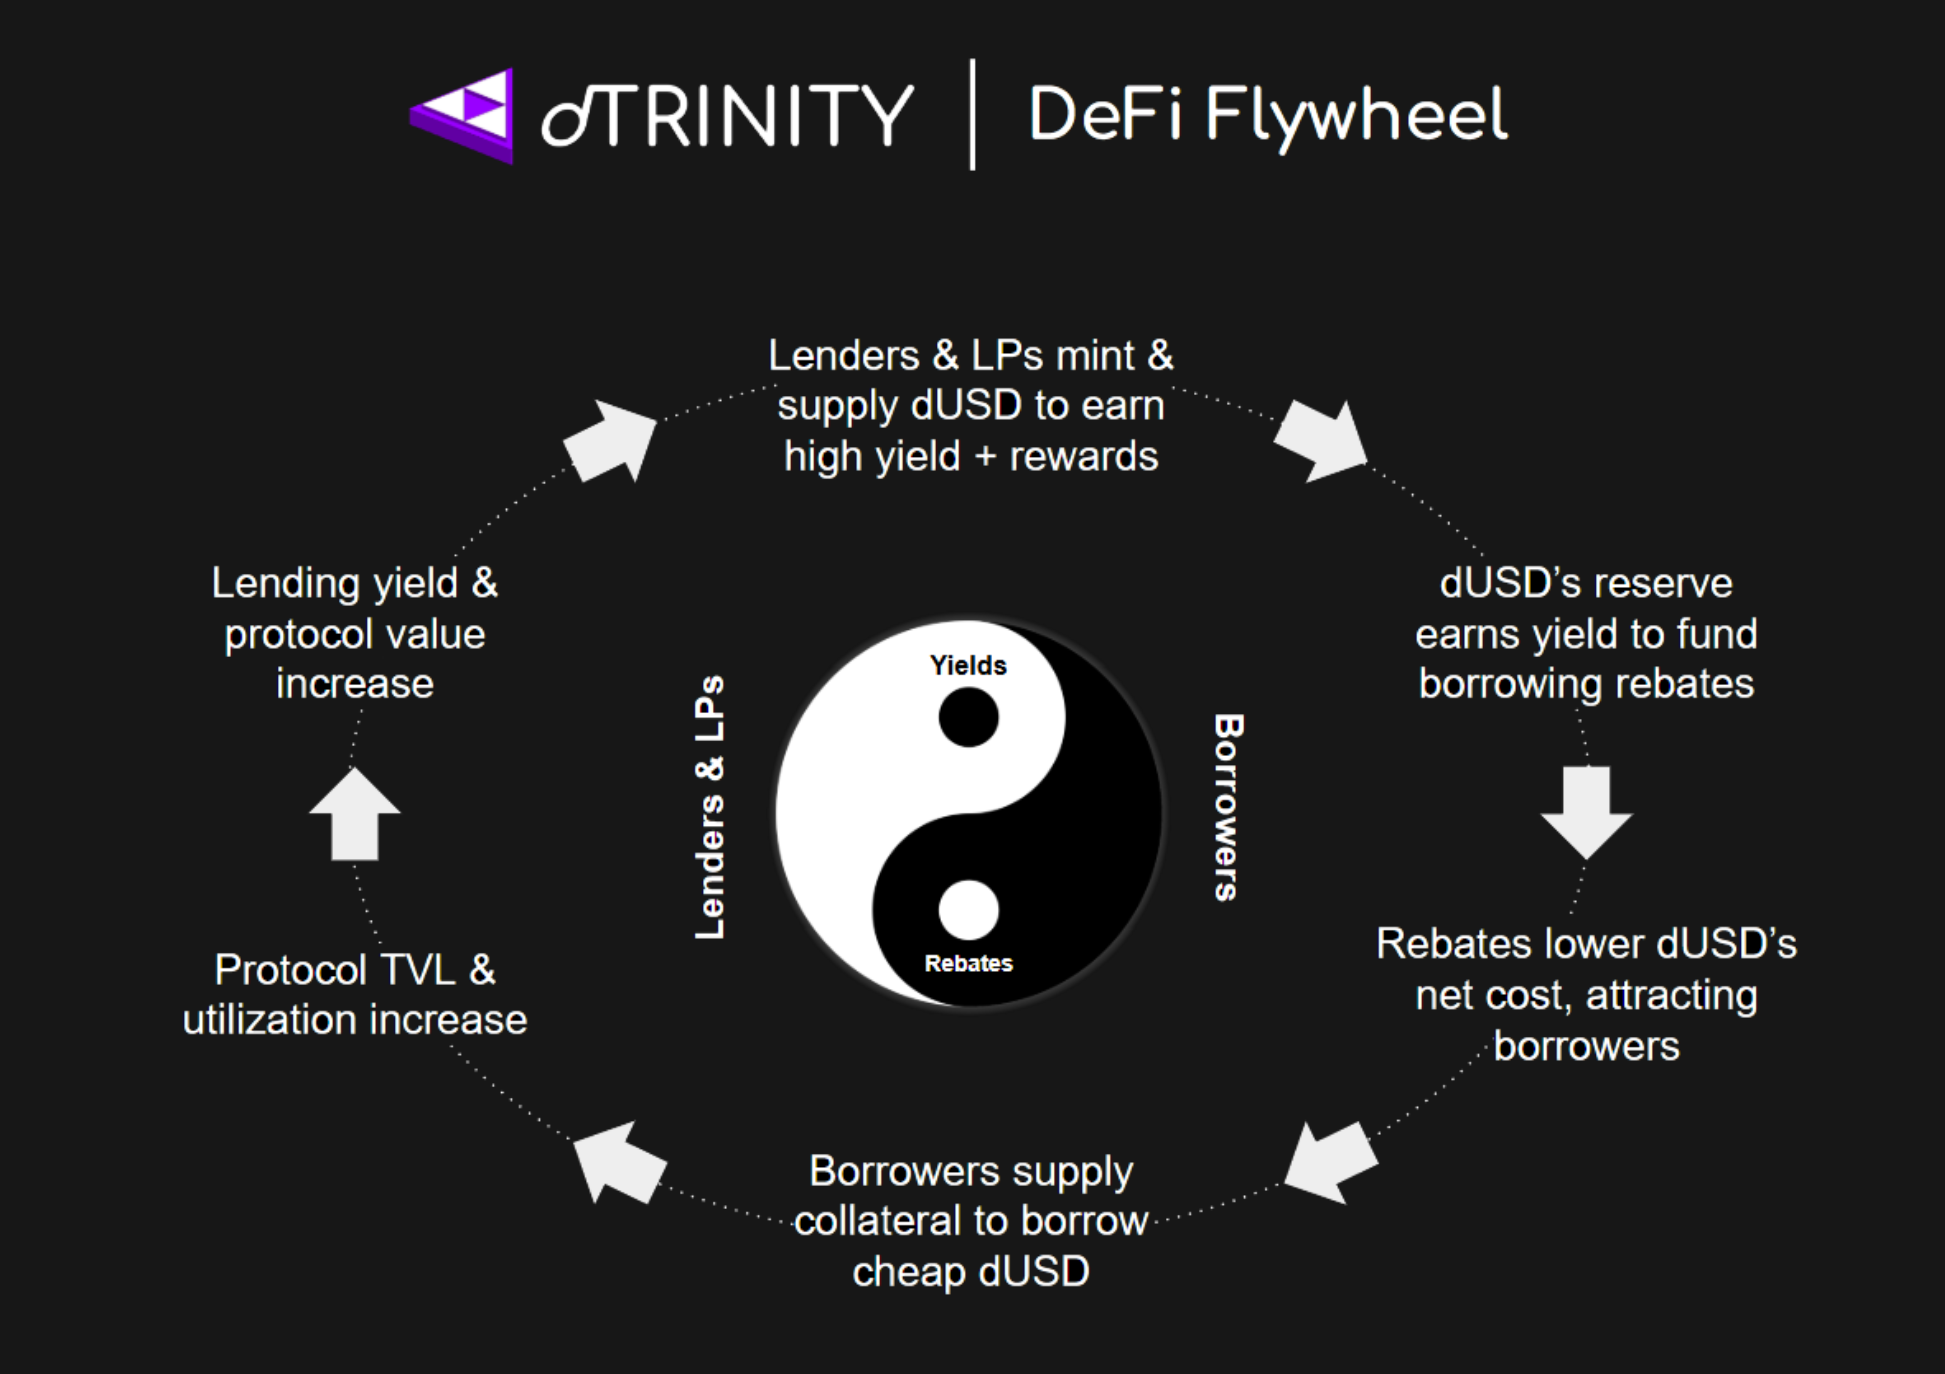
dUSD is classified as an unregulated, non-yield-bearing stablecoin or synthetic dollar, designed to be a superior medium of credit. By separating yield from the unit of account, dUSD avoids distorting the price of credit and compounding costs for borrowers. Instead, float revenue generated by dUSD’s reserve is redirected to users as interest rebates, further lowering its net borrowing cost to stimulate demand. This produces structurally higher utilization and yield for lenders (including  sdUSD yieldcoin holders), allowing dUSD to function as a more efficient medium of credit across market cycles.
sdUSD yieldcoin holders), allowing dUSD to function as a more efficient medium of credit across market cycles.Additionally, interest rebates are generally not considered yield, as they function as a reduction in borrowing costs rather than income generated from holding the asset itself. In financial and legal frameworks, rebates, discounts, and fee reductions are typically treated as pricing adjustments rather than investment returns. This distinction has longstanding precedent across TradFi—for example, mortgage interest deductions, credit card cashback programs, brokerage fee rebates, and manufacturer rebates—which reduce effective costs without reclassifying the underlying instrument as a yield-bearing asset.
3.4. Stablecoin vs. Yieldcoins
Most stablecoins are built under the ERC-20 token standard on Ethereum and EVM networks, while tokenized yield strategies are often implemented as ERC-4626 vaults. These smart contract-powered vaults allow users to deposit/stake assets like stablecoins into them to mint a composable, yield-bearing receipt token or tokenized vault share, i.e., a “yieldcoin.”
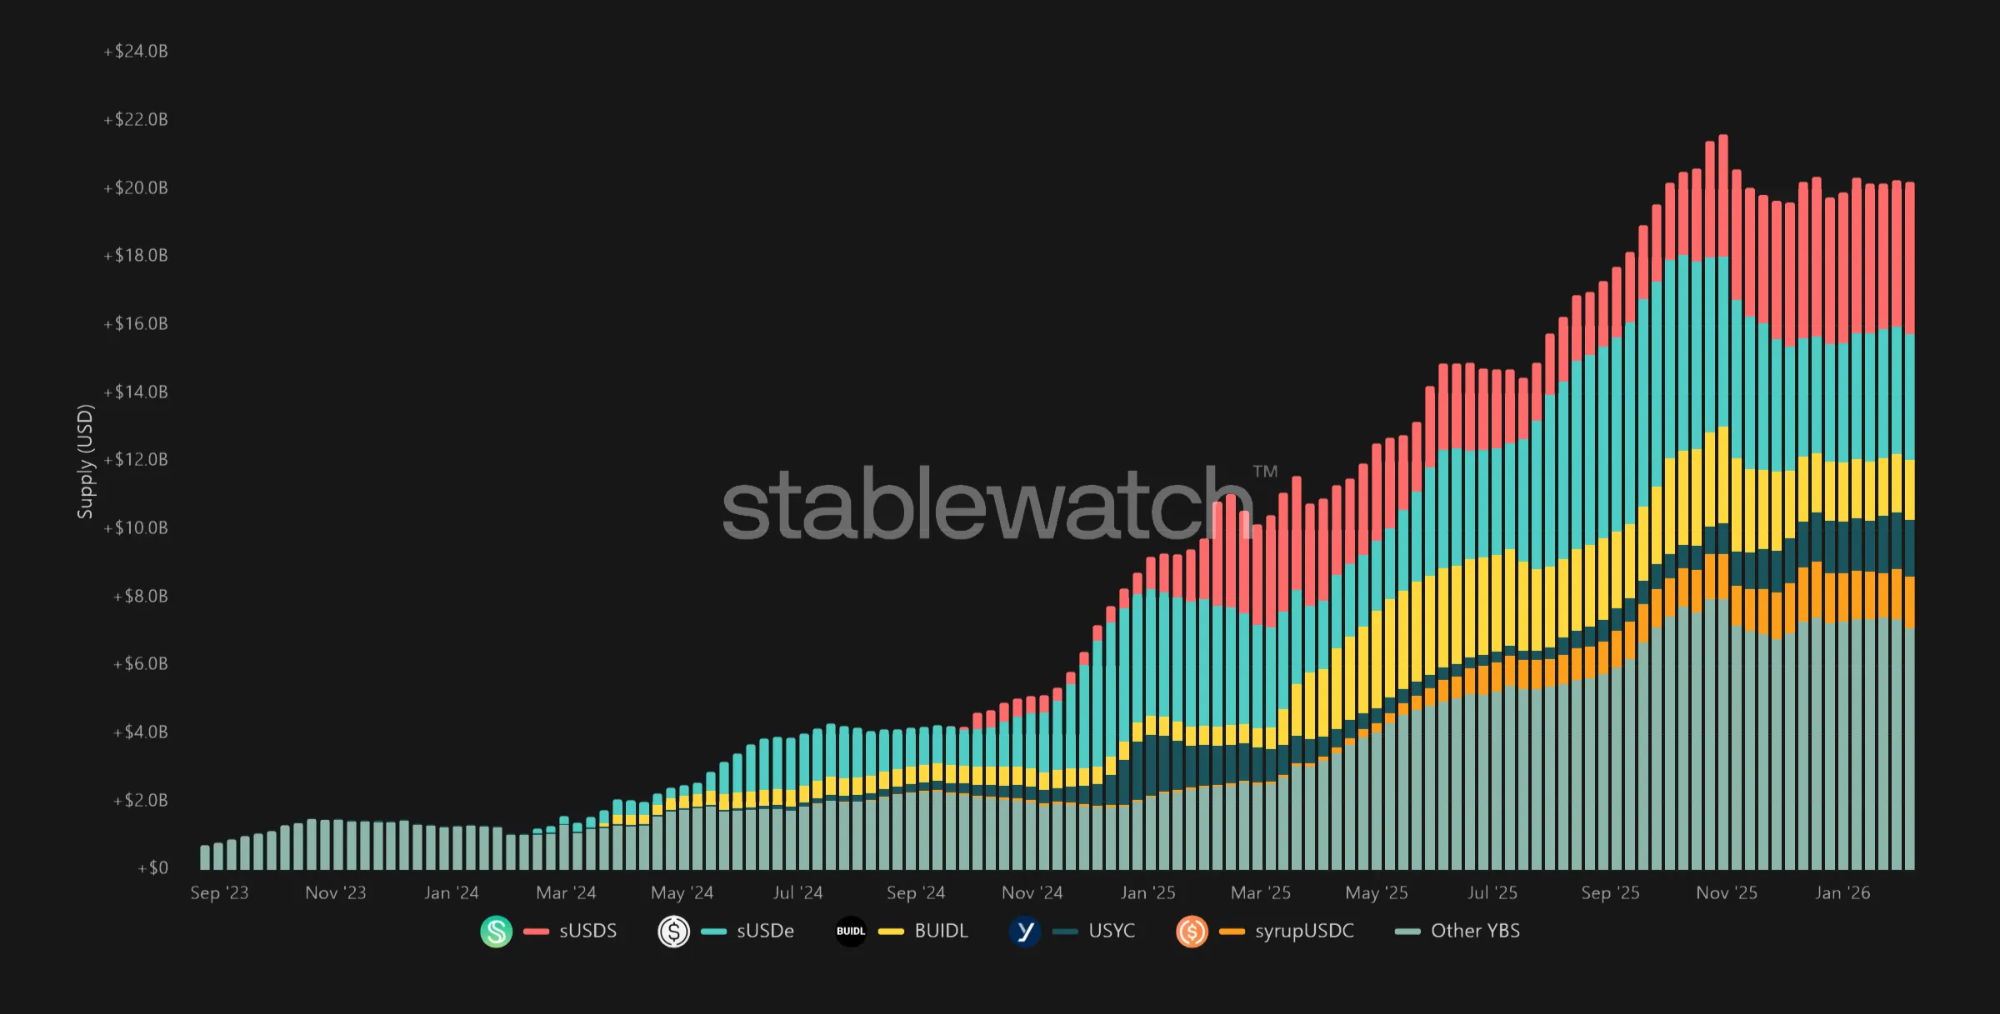
While the concept of tokenized strategies has existed since the early days of DeFi, yieldcoins as a standardized and widely composable primitive are relatively new, with meaningful adoption only starting in 2024 following the proliferation of ERC-4626 infrastructure. By the end of 2025, yieldcoins have grown to $20 billion in market capitalization, or 6.5% vs. total stablecoin supply. JPMorgan also projected yieldcoins to reach 50% of the stablecoin market’s size within a few years.
Total Yieldcoin Supply
Total Yield Paid Out by Yieldcoins
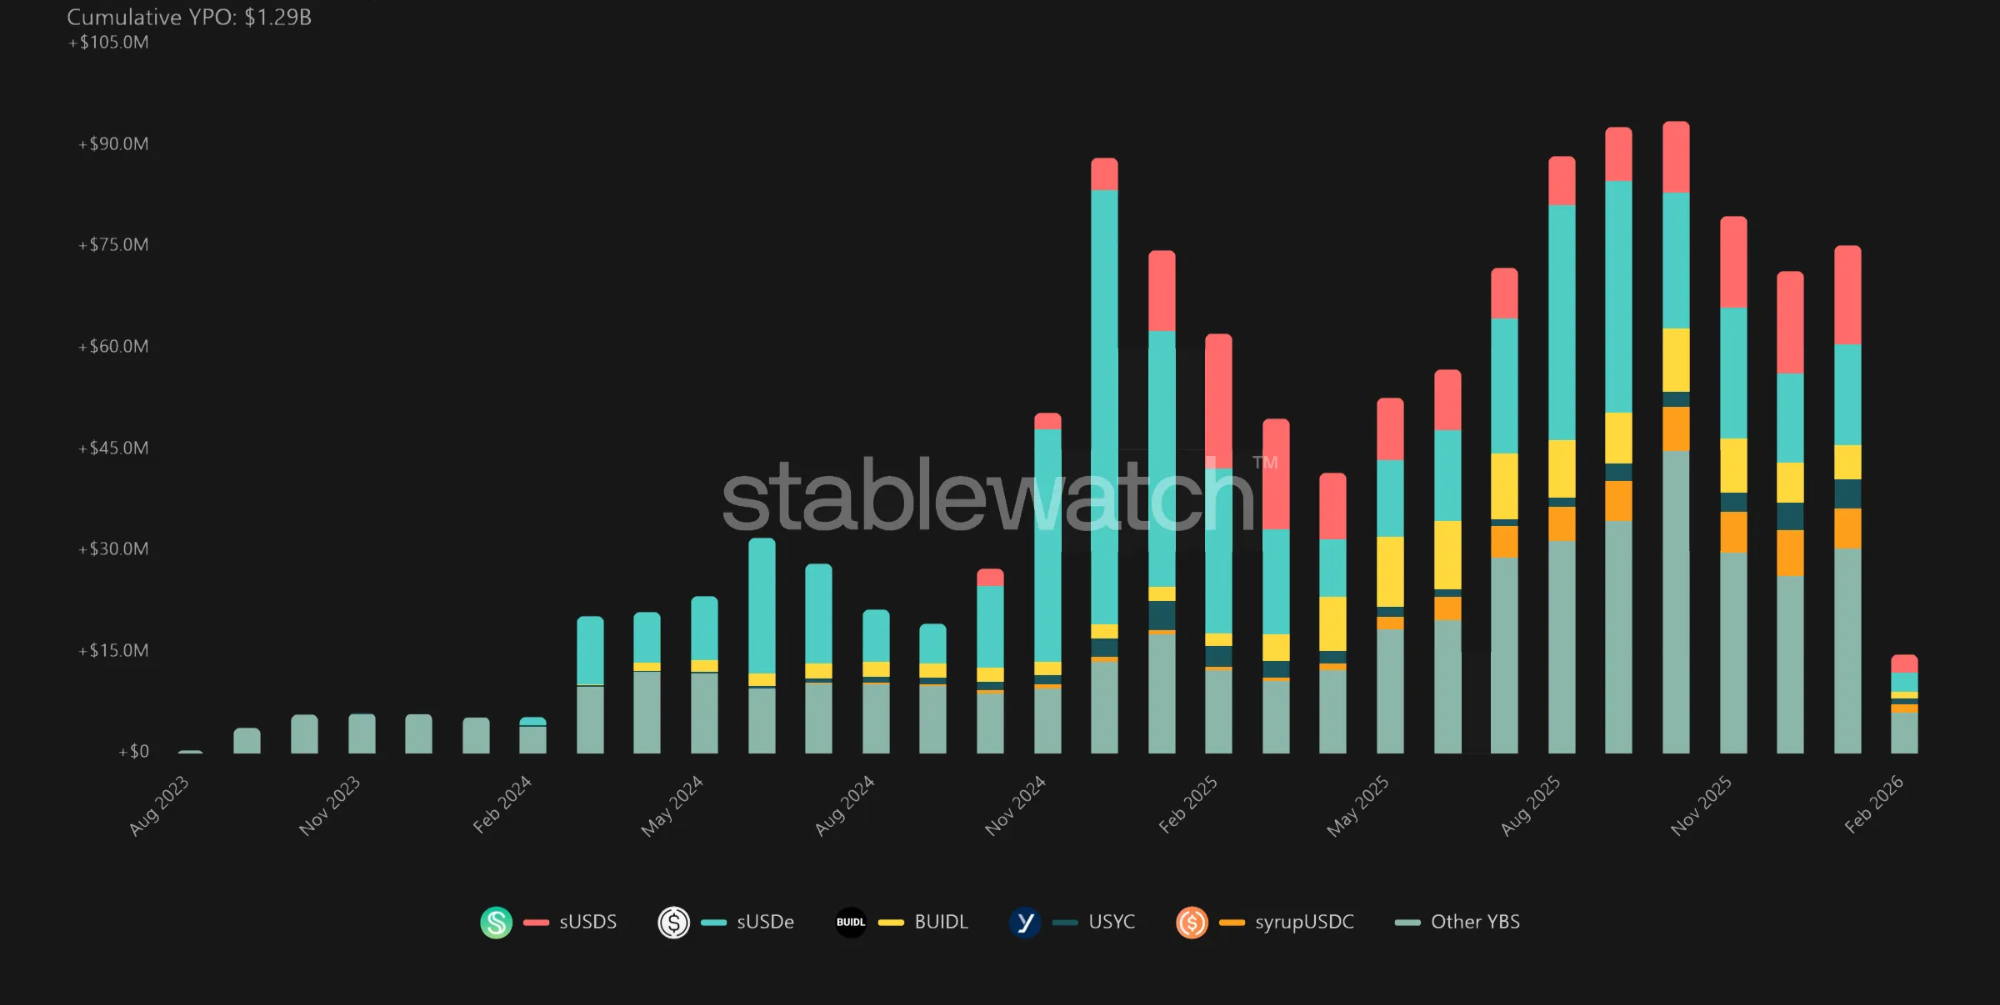
An ERC-4626 vault is designed to accumulate yield internally, which increases its NAV (net asset value) and allows users to redeem/unstake more underlying assets per receipt token over time. Vault earnings may come from issuers of the underlying assets and/or from deploying those assets directly into yield strategies, such as onchain lending. Every strategy has its own unique risk/reward profile. A vault's performance, solvency, and long-term viability ultimately depend on how well its strategy manages risk vs. yield opportunities across market cycles.
Some yieldcoins are implemented simply as ERC-20 tokens without vault structures. These tokens are usually tokenized RWAs, such as T-Bills and money market funds. Other yield-bearing RWAs could also be tokenized into ERC-20 yieldcoins (e.g., mortgages, corporate debts, private credit).
A yieldcoin's market price adjusts over time due to arbitrage forces that soft-peg it to the unit NAV, similar to stablecoins. How closely its market price tracks the underlying value depends on the vault’s/strategy’s solvency, collateral integrity, redeemability, market confidence, and arbitrage forces. The resulting secondary market liquidity determines whether the yieldcoin trades at a discount or premium to unit NAV.
Since yieldcoins are tradable tokens, holders can sell them on exchanges to realize gains as the token price gradually appreciates to reflect yield accrual inside the vault. Yieldcoin holders can also supply their tokens into DeFi protocols as collateral or liquidity to access additional leverage, yields, or utilities, unlocking higher capital efficiency through DeFi composability.
While still nascent, yieldcoins represent the emergence of a savings layer in the onchain monetary system—analogous to interest-bearing deposits in traditional banking. As they continue to mature, yieldcoins could become core programmable savings instruments, enabling users to store value against inflation while supporting credit intermediation to power the onchain economy.
Stablecoins may be used to mint yieldcoins, and yieldcoins may be redeemed for stablecoins, but yieldcoins are NOT stablecoins. Regulators may also treat certain yieldcoins as security tokens.
3.5. Stablecoin & Yieldcoin Risks
Stablecoins are NOT risk-free. Stablecoins may de-peg or lose value, and they are generally not insured by the government. While they are designed to maintain price stability, a stablecoin's health ultimately depends on its economic design, core infrastructure, collateral integrity, redeemability, market liquidity, security, transparency, and many other important factors.
Yieldcoins carry even higher inherent risk than stablecoins, particularly when issued in unregulated DeFi environments that are still relatively young compared to TradFi. Because investors demand more compensation for additional risks, higher yields in DeFi often indicate higher underlying risk exposure rather than just improved capital efficiency.
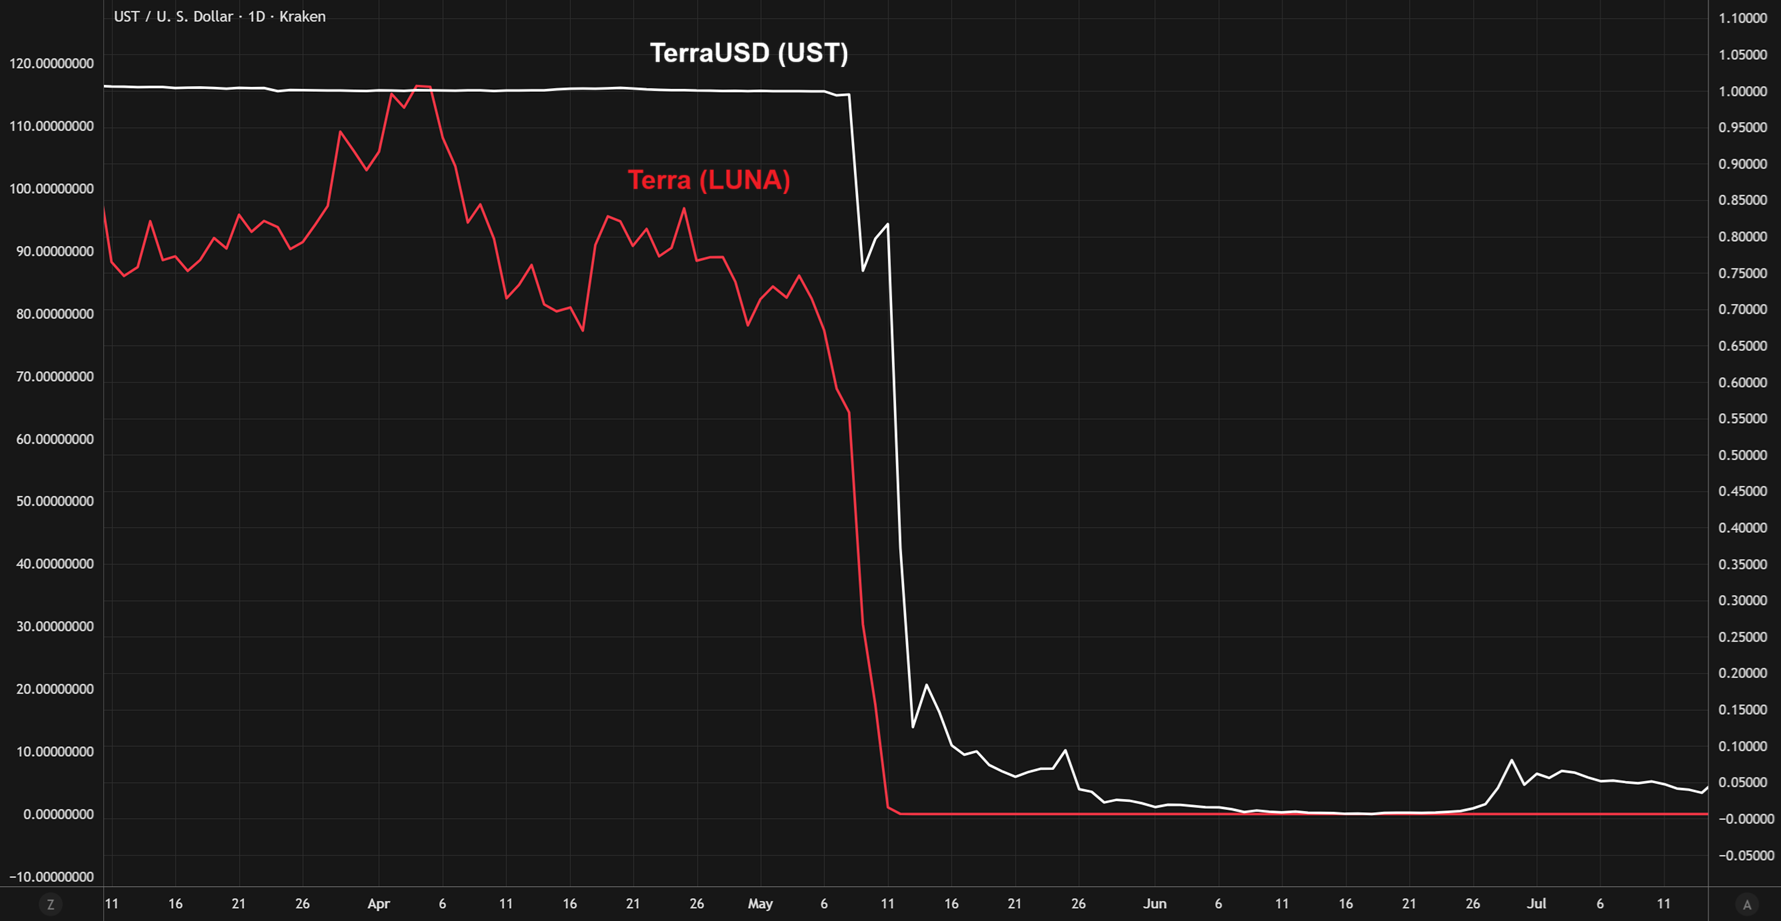
Terra UST Collapse (2022)
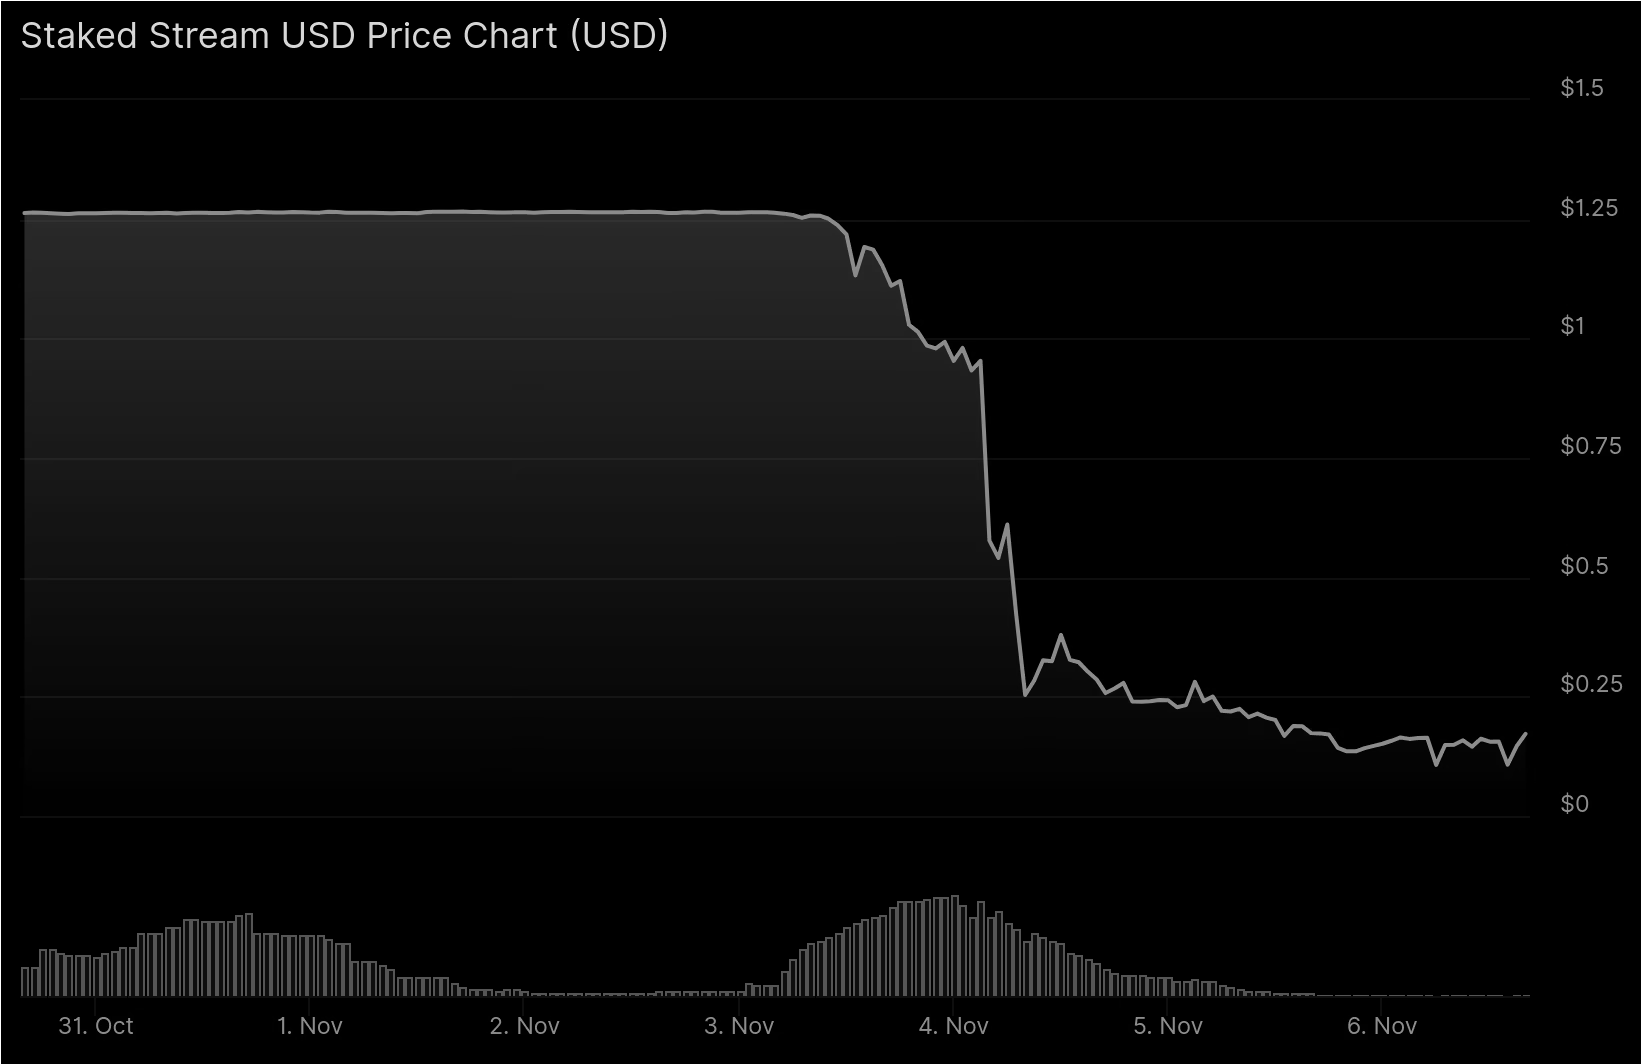
Stream Finance xUSD Collapse (2025)
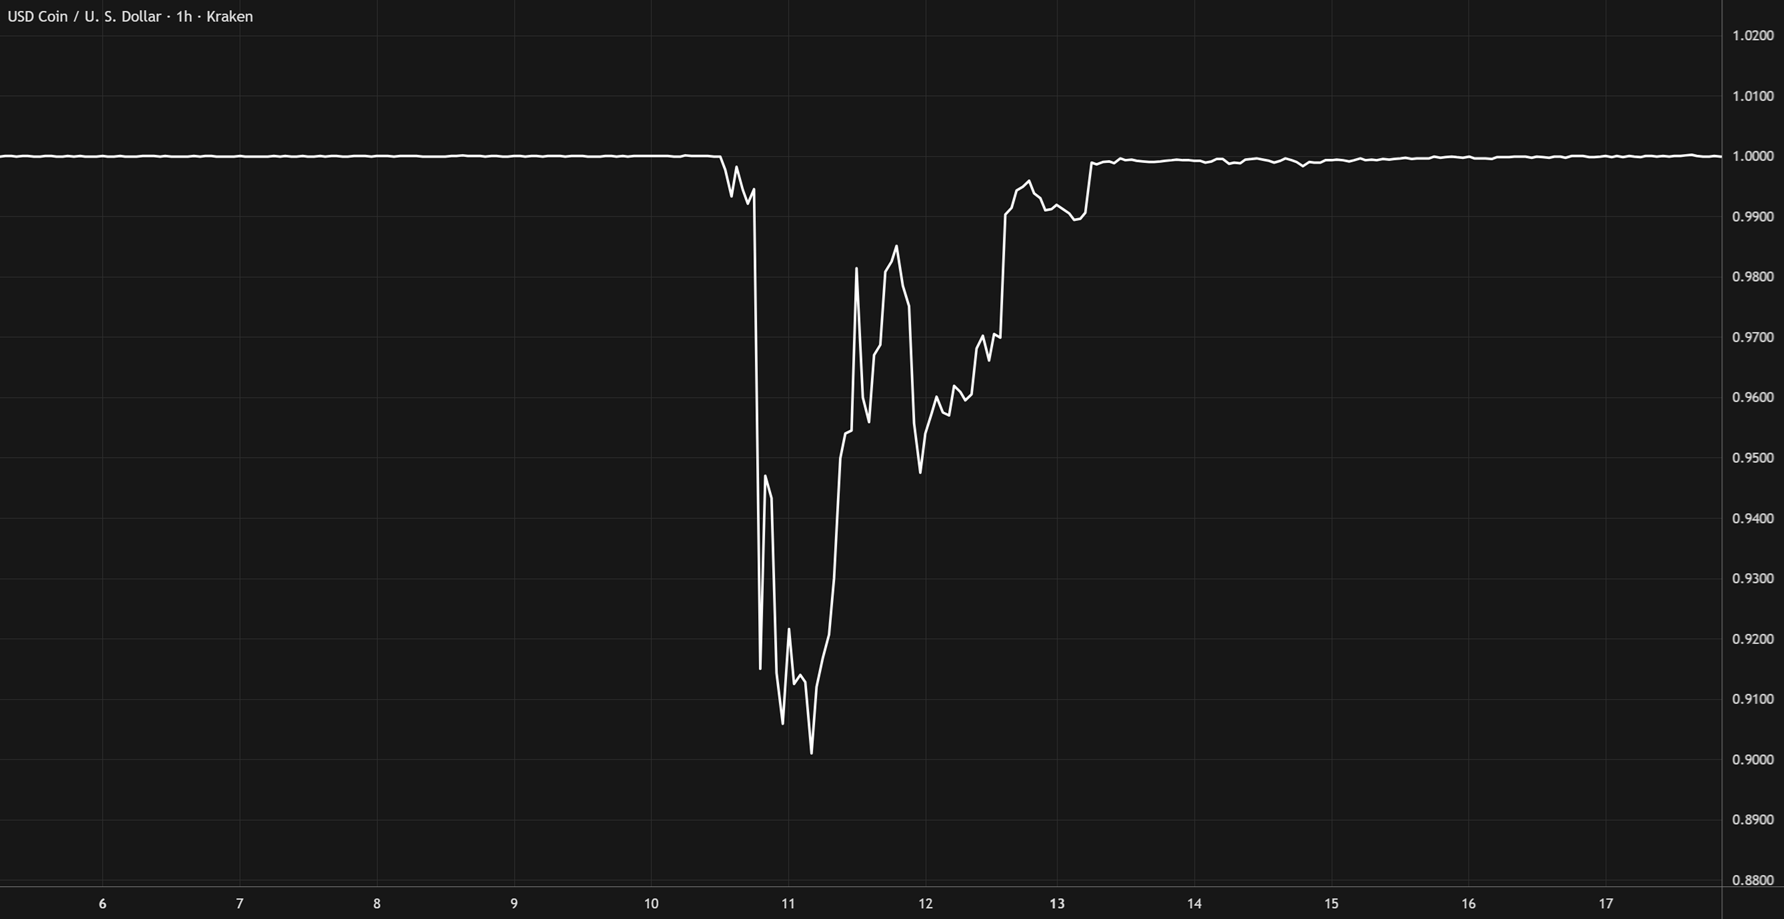
Circle USDC De-Peg (2023)
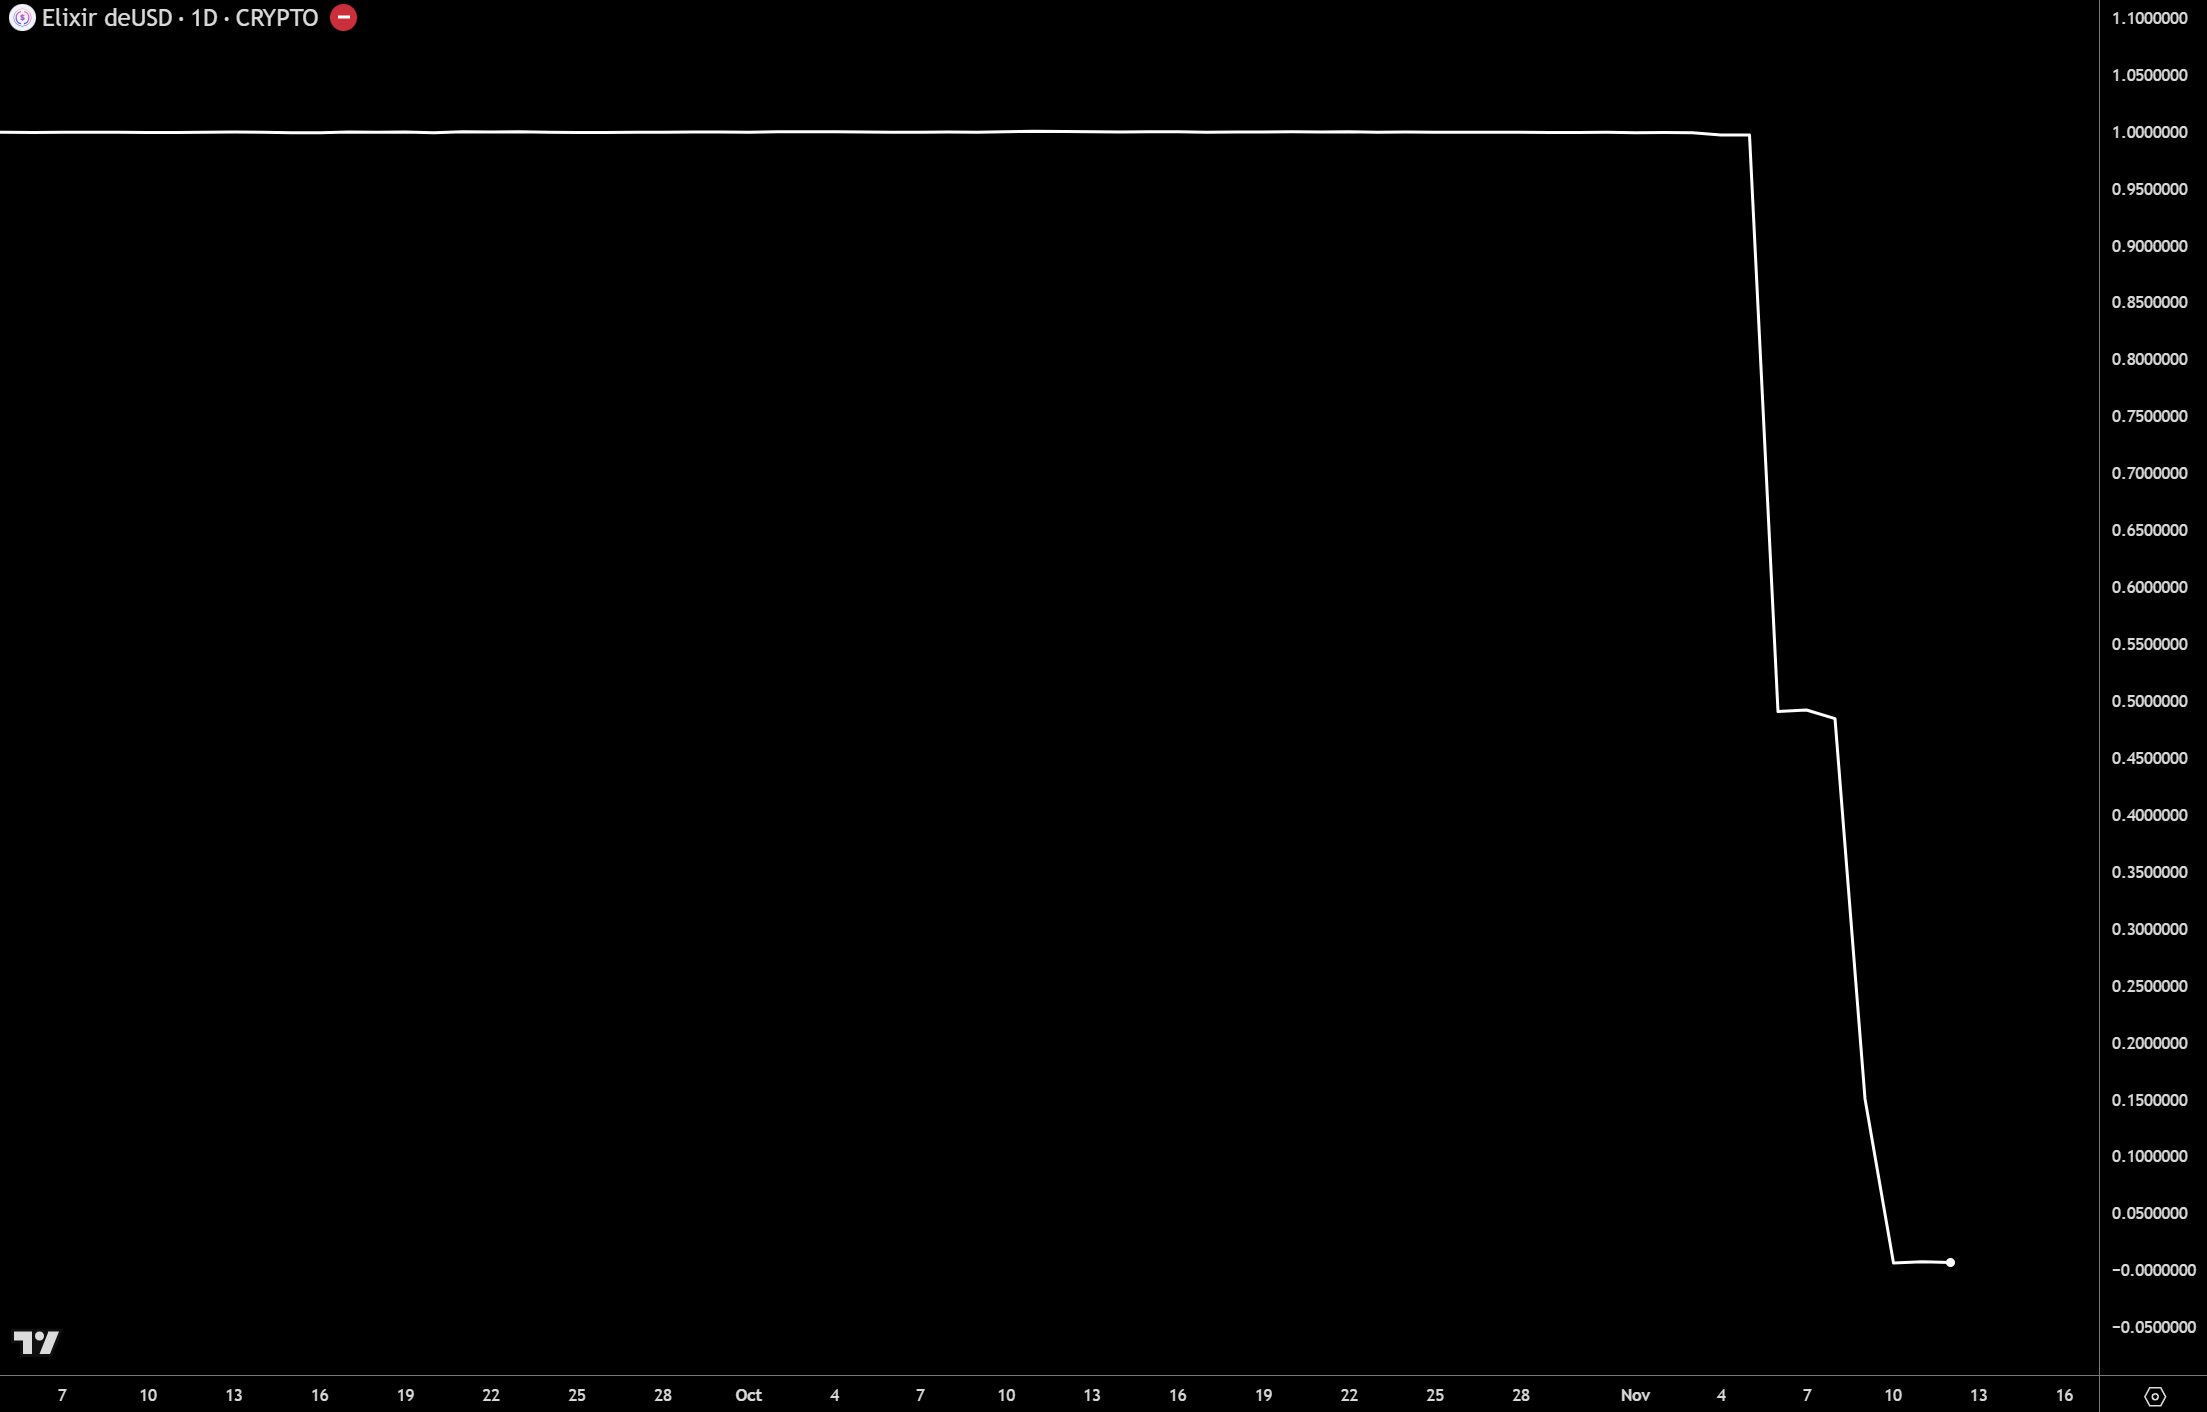
Elixir deUSD & sdeUSD Collapse (2025)
Potential Risks (Non-Exhaustive)
Collateral / Reserve Risk | Backing assets may decline in value, lose liquidity, or underperform during stressed market conditions, reducing effective collateral coverage and redemption capacity |
De-Peg Risk | Market price may deviate from the intended peg due to supply-demand imbalances, liquidity fragmentation, or declining market confidence during periods of market volatility |
Liquidity Risk | Large or sudden redemption demand may exceed available liquid reserves, creating withdrawal delays, forced asset sales, or self-reinforcing redemption pressure and run dynamics |
Credit Risk | Issuers or counterparties backing reserve assets may default or restructure obligations, impairing reserve value, collateral integrity, and token redemption expectations |
Leverage Risk | Use of leverage across protocol positions may amplify losses and volatility, triggering liquidations, cascading sell pressure, and broader liquidity stress during adverse conditions |
Blockchain Risk | Network congestion, validator outages, or consensus disruptions may delay transaction confirmation, impair settlement finality, or temporarily disrupt protocol functionality and access |
Smart Contract Risk | Software bugs, vulnerabilities, or exploit attacks within smart contracts may result in loss of funds, unauthorized transfers, or permanent locking of user assets |
Irreversibility Risk | Blockchain transactions are irreversible, and user errors, compromised wallets, or incorrect smart contract interactions may lead to permanent and unrecoverable loss of funds |
Composability Risk | Dependencies among integrated DeFi protocols may introduce systemic risk, allowing failures, exploits, or liquidity shocks to propagate across interconnected ecosystems |
Infrastructure Risk | Failures in onchain or offchain infrastructure, including oracles, APIs, or hosting services, may disrupt pricing data, execution, access, or redemption operations |
Operational Risk | Operational failures such as governance errors, key management failures, or cybersecurity incidents may impair system functionality, decision-making processes, or asset security |
Counterparty Risk | Third-party service providers or integration partners may fail to fulfill obligations, potentially causing operational disruptions, settlement delays, or financial exposure |
Custodian & Banking Risk | Custodians or banking partners safeguarding reserves may experience insolvency, access restrictions, or operational failures affecting collateral availability and redemption processes |
Sovereign Risk | Government default, debt restructuring, or macroeconomic instability may impair government securities held as reserves, negatively impacting collateral value and system stability |
Regulatory Risk | Changes in laws, regulations, or enforcement actions may restrict token issuance, redemption, transferability, or user access, materially affecting protocol operations |
Any risk mentioned above as well as other unforeseen risks could potentially lead to loss of funds. Consequently, users should conduct their own due diligence, fully understand these risks, and seek official advice from licensed professionals before interacting with DeFi protocols and digital assets, including stablecoins and yieldcoins.
The information provided in this document is meant for informational and educational purposes only, not financial, legal, or tax advice. Past performance is not indicative of future results.
4. Stablecoin Money Supply
4.1. Overview
In modern banking, both the fiat money supply and the credit layer are created endogenously under a loans → deposits → reserves model (i.e., fractional-reserve). By contrast, reserve-backed stablecoins operate on an exogenous reserve base (i.e., full-reserve), where token issuance and credit intermediation happen separately under a reserves → deposits → loans model.
Traditionally, fiat credit expansion increases the total money supply, while credit contraction tends to decrease it. On the other hand, credit expansion for reserve-backed stablecoins can actually reduce their money supply, while credit contraction may increase it. These dynamics are structurally inverted due to the separation between money and credit in a full-reserve system.
Fiat Money & Credit Creation Process ♾️
Endogenous bank lending → Money creation → Deposits & spending → Interbank reserve settlements → Central bank accommodation → More lending & spending → Money supply expands → Inflationary pressure.
- Commercial banks “print” new loans endogenously, which are recorded as bank assets. Loans simultaneously create new money as bank deposit liabilities, expanding the total money supply.
- Borrowers spend the newly created deposits, circulating bank money into the economy. Most of it is re-deposited back into commercial banks.
- As deposits move between banks, interbank payments are settled using reserves, which shift between their master accounts at the central bank to clear net payment flows.
- The central bank accommodates reserve demand as needed, supplying commercial banks with base money elastically through bank asset (loan) purchases, lending facilities, and other balance sheet tools to maintain its policy targets.
- As long as reserve settlements function smoothly, commercial banks can continue extending loans, further raising deposits and spending activity. This allows credit and deposit balances to expand the total money supply. If credit outpaces real economic productivity, it can result in inflation and systemic instability.
Stablecoin & Credit Intermediation Process ☯️
Exogenous reserves → Stablecoin issuances → Lending deposits → Borrowing & spending → Arbitrage & redemptions (if market liquidity is low) → Reserve outflows → Money supply contracts → Peg stability.
- The stablecoin issuer creates new tokens as liabilities only when minters have deposited reserve assets. These assets fully back the stablecoin on a 1:1 basis, enforcing a hard peg via redemption.
- Users receive newly minted stablecoins in their wallets. Unlike bank money, reserve-backed stablecoins cannot be created from loans. Therefore, the stablecoin’s circulating supply should never exceed the size of its underlying reserve.
- Users can now transfer stablecoins between wallets, exchanges, and decentralized applications, settling them directly on blockchain networks.
- For borrowers to access credit, lenders must first deposit stablecoins into lending markets after minting them. Once borrowed, the stablecoins are sold or redeemed if market liquidity is unable to absorb selling pressures. This contracts circulating supply and underlying reserves as debt increases in the system.
- Reserves act as an explicit backstop to support the peg stability and limit credit expansion. Until new reserves, deposits, or liquidity enter the system, new loans cannot be created.
4.2. Monetary Aggregates
Central banks have yet to determine how to formally incorporate stablecoins, particularly regulated payment stablecoins, into existing monetary aggregates such as M0, M1, M2, and M3. Since a large share of stablecoin reserves currently consist of government securities, they could be viewed as tokenized claims on sovereign credit (without embedded yield for holders). However, from a transactional perspective, payment stablecoins still function similarly to digital cash. This hybrid nature complicates their classification within traditional aggregates, raising the question of whether stablecoins should be treated as narrow money, near money, or broad money. The answer will materially affect how central bankers and regulators treat stablecoins in the long run.
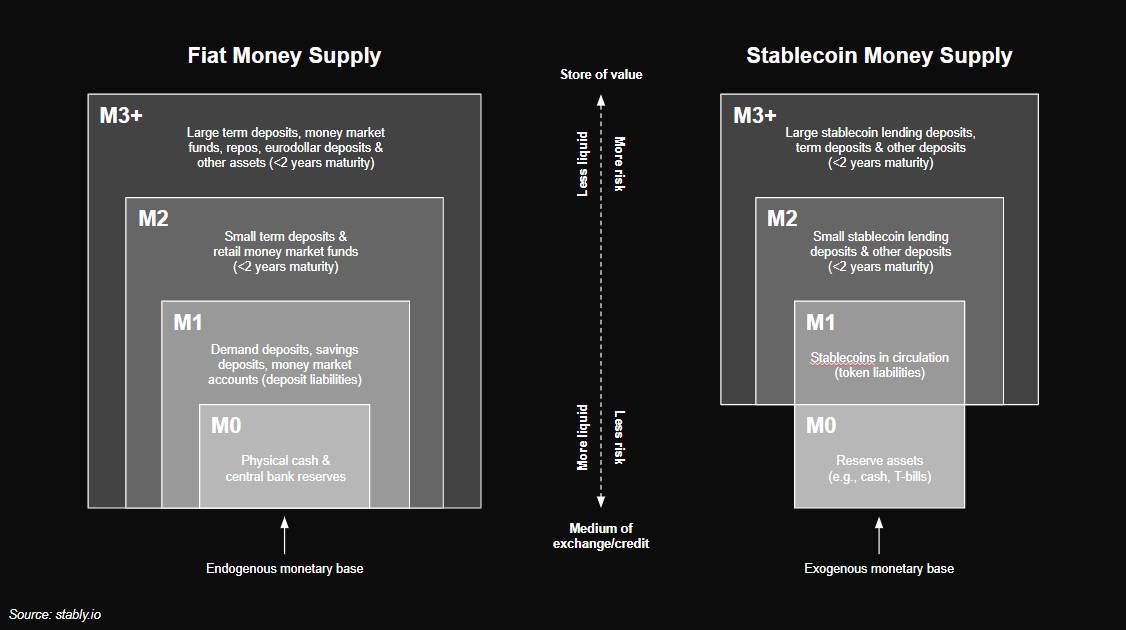
When analyzed as a standalone monetary system, a reserve-backed stablecoin’s money supply can be measured using aggregate classifications analogous to those used in fiat systems:
Fiat Money | Reserve-Backed Stablecoins | |
Base Money (M0) | Physical cash minted by the U.S. Treasury + central bank reserves created endogenously via the Fed’s balance sheet expansion mechanisms. Reserves are held by commercial banks at the Fed and may earn interest as an inflationary hedge. | Liquid, exogenous assets held in reserve to back circulating stablecoins on a 1:1 basis. If reserves are yield-generating, they provide an additional inflationary hedge to the monetary base. |
Narrow Money (M1) | M0 + liquid deposit liabilities, including demand deposits created endogenously through bank loans, savings deposits, and money market accounts (MMAs). | Circulating stablecoins (token liabilities) in wallets + liquid stablecoin deposits held in exchanges, bridges, protocols, and smart contracts that have not been borrowed. |
Near Money (M2) | M1 + small term deposits and retail MMFs, i.e., retail deposit liabilities and securities.Note: Since 2020, the Fed reclassified savings deposits and retail MMAs (not MMFs) from M2 to M1, reflecting the removal of limits on transfers under Regulation D. | M1 + small stablecoin lending deposits, term deposits, and other deposit liabilities in CeFi/DeFi with <2 years maturity.Note: The Fed does not classify monetary aggregates by maturity, whereas the ECB incorporates maturity limits into its definitions, primarily <2 years. |
Broad Money (M3+) | M2 + large term deposits, MMFs, repos, eurodollars, and other assets, i.e., institutional deposit liabilities and securities.Note: The Fed stopped tracking M3 in 2006. | M2 + large stablecoin lending deposits, term deposits, and other large deposit liabilities in CeFi/DeFi with <2 years maturity. |
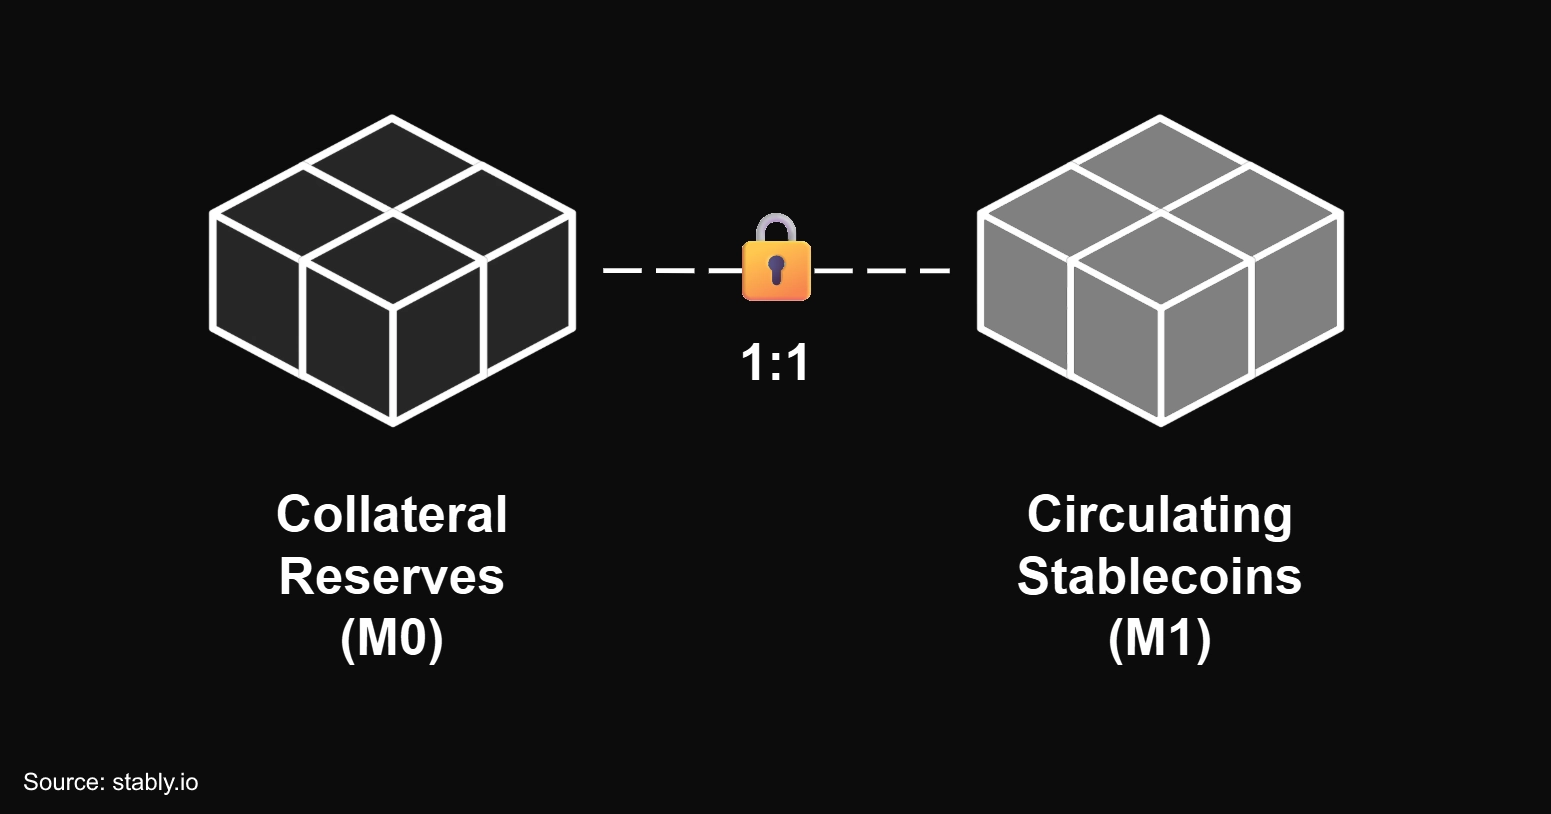
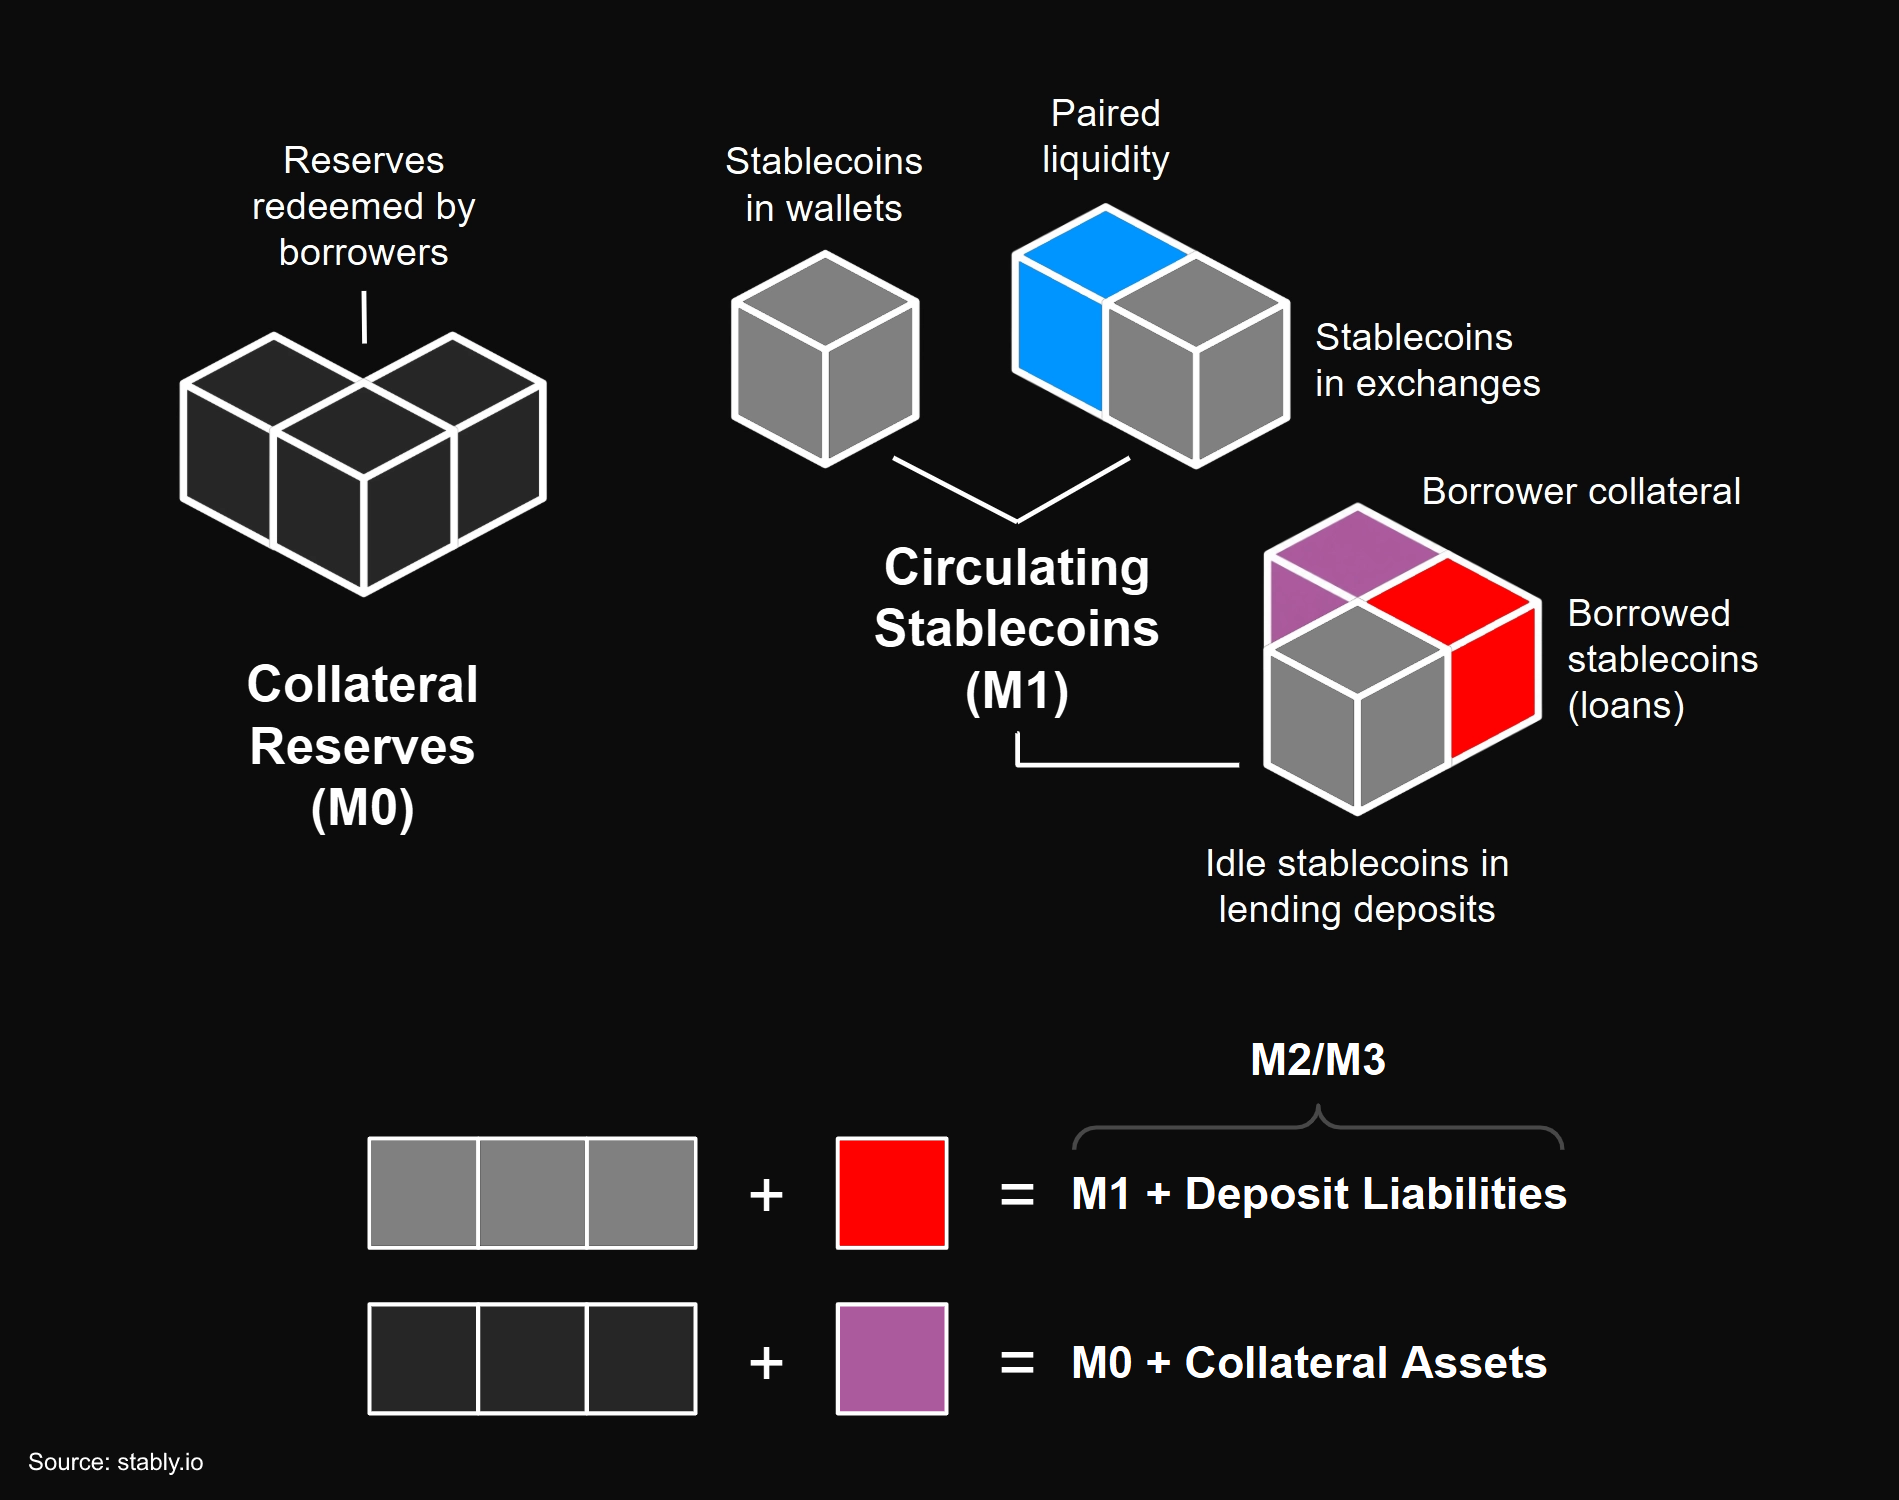
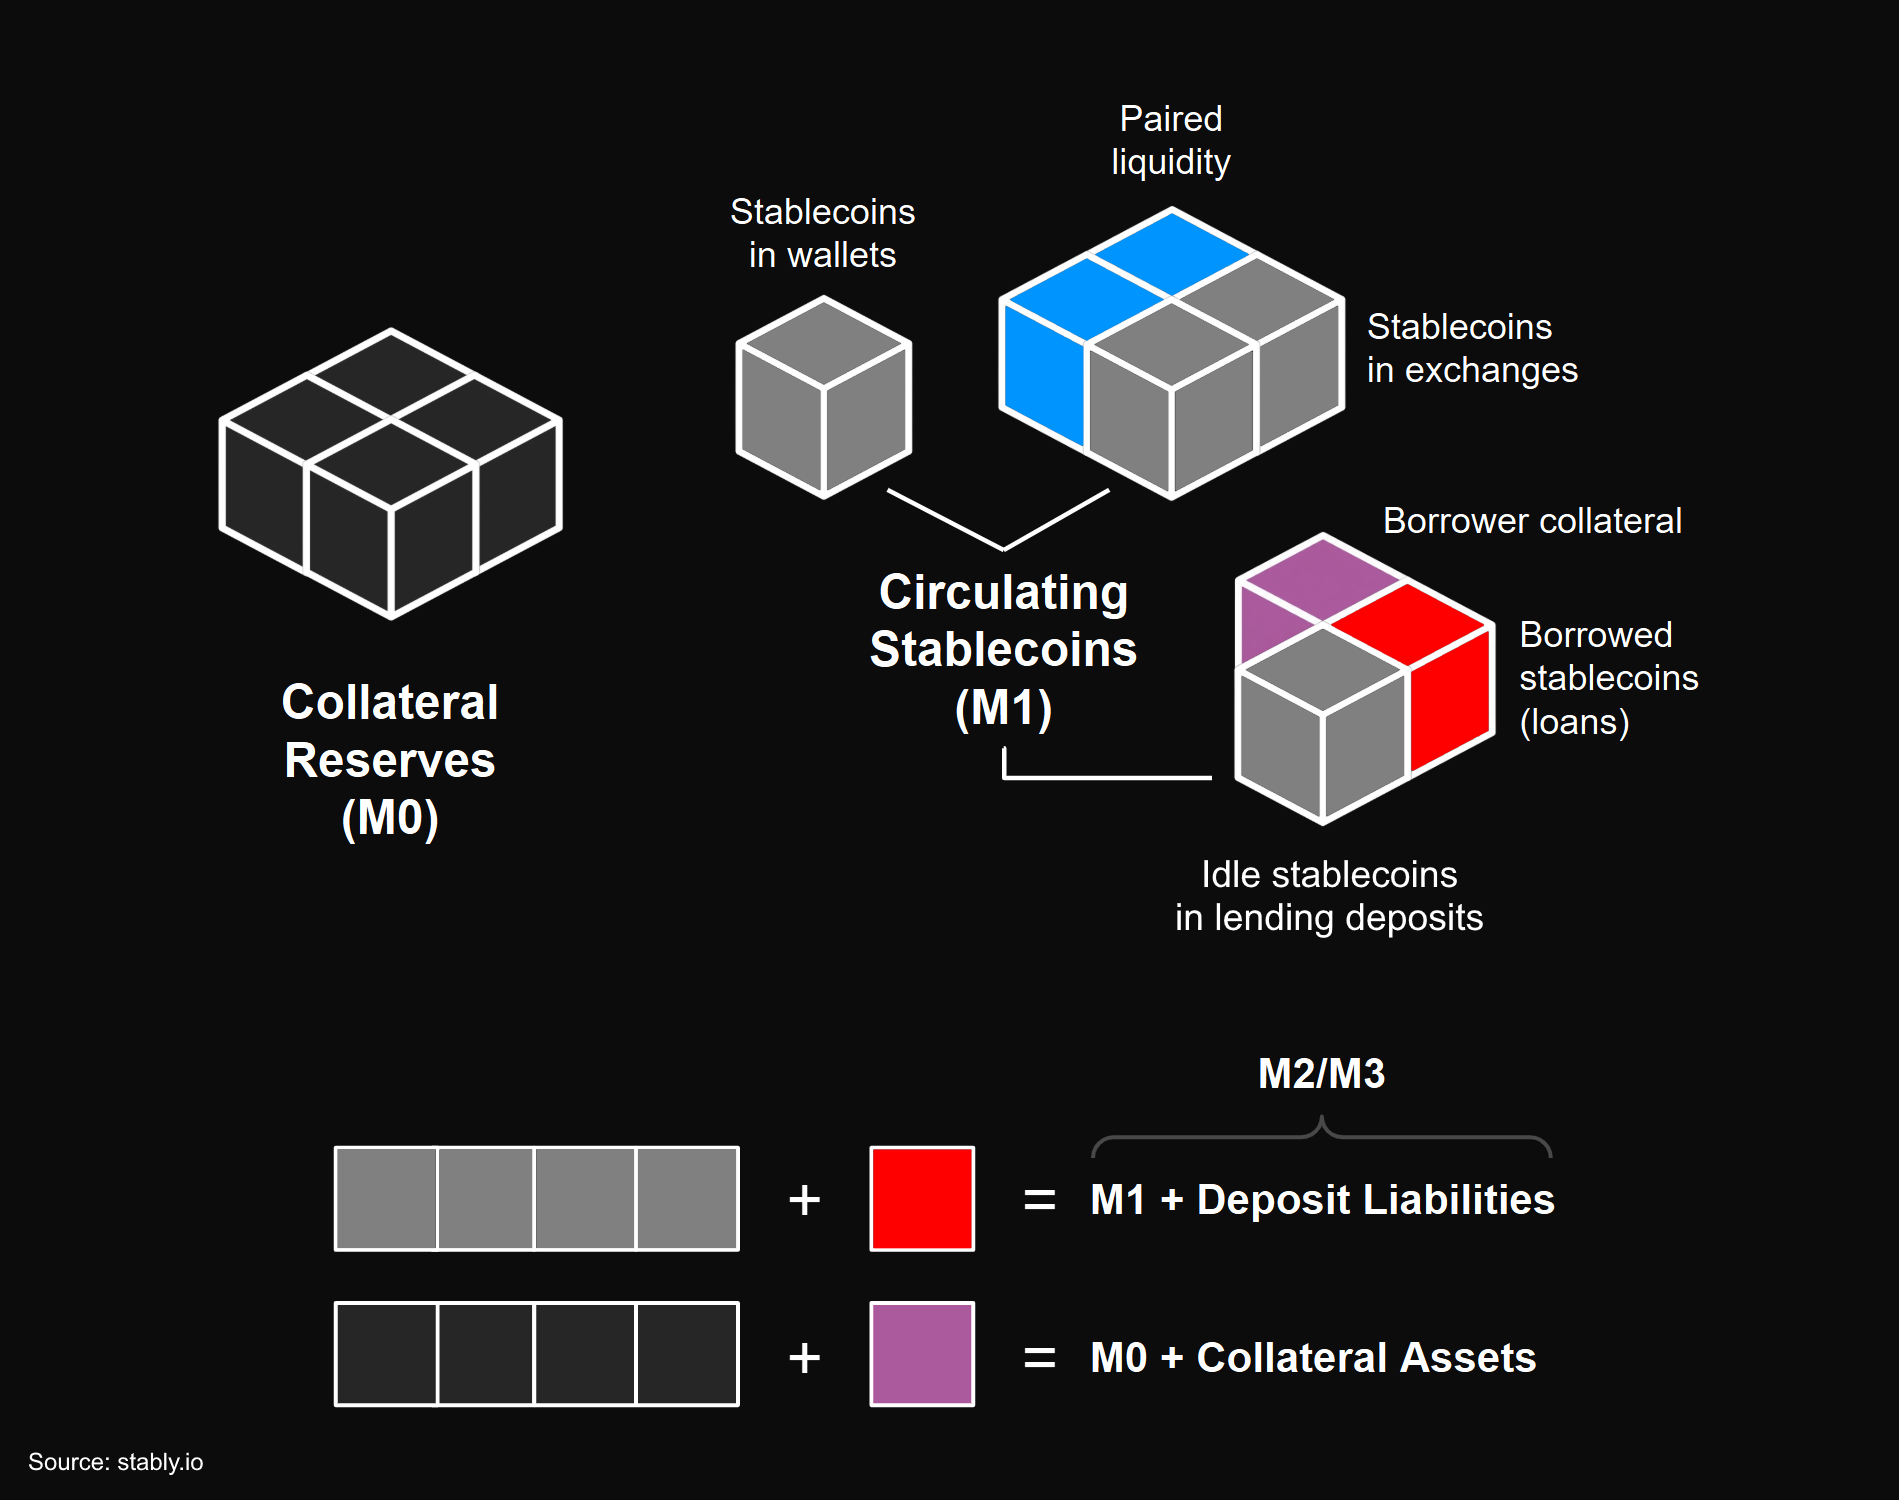
4.3. Stablecoin M0 & M1
- External assets form a reserve-backed stablecoin’s reserve base (M0), providing it with final settlement liquidity while collateralizing its circulating supply (M1) on a 1:1 basis.
- M1 includes all stablecoins in circulation across user wallets, exchanges, bridges, and smart contracts that are immediately redeemable/transferrable/spendable. This is considered the stablecoin’s narrow money supply.
- Unlike fiat money which has an endogenous monetary base, a stablecoin’s reserve base is exogenous and non-fungible with the token itself. As a result, M1 does not include M0 within its definition for these stablecoins.
- Unlike bank money (deposit liabilities), reserve-backed stablecoins (token liabilities) must be collateralized 1:1, which means their M1 can never be greater than M0.
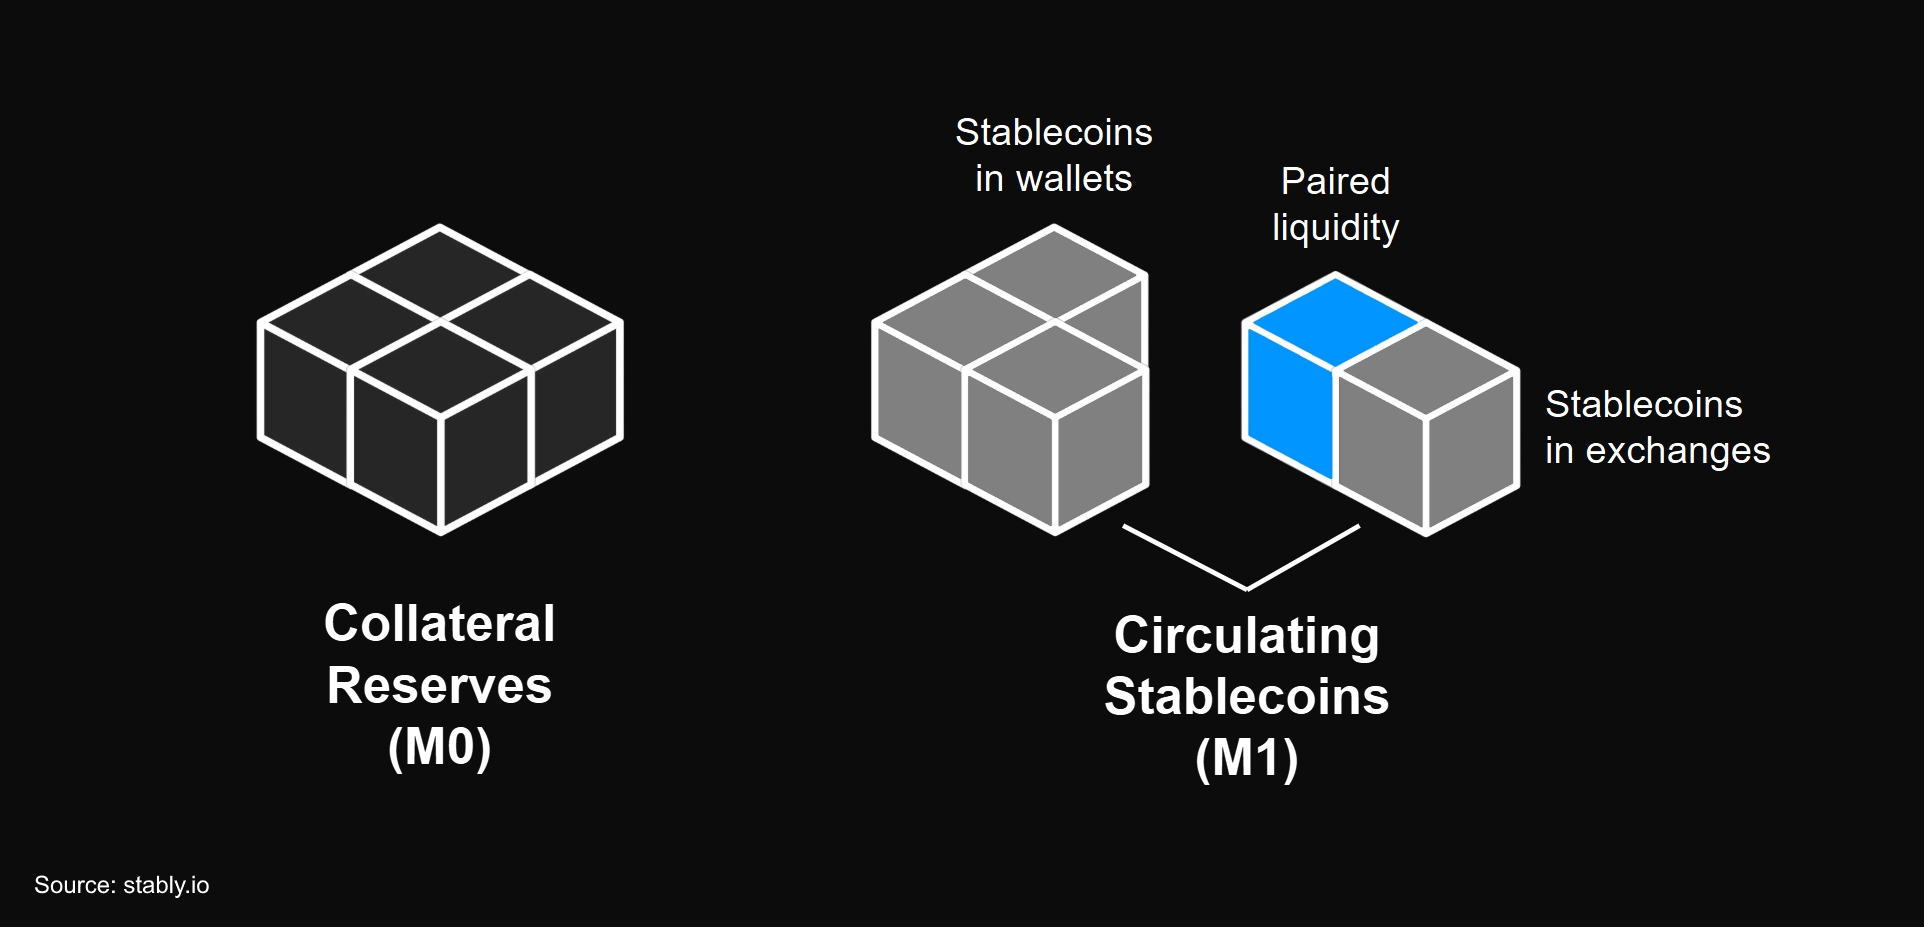
4.4. Liquidity & Stability
- A stablecoin by itself has no market price unless it is liquid, i.e., tradable against other assets. The total value of assets that are actively paired against the stablecoin across exchanges is what enables secondary market liquidity for it.
- Market price is based on total liquidity paired against the stablecoin’s tradable supply, where marginal order flows determine prevailing exchange rates between it and other assets. More stablecoins vs. paired liquidity = downward peg pressure; less stablecoins vs. paired liquidity = upward peg pressure.
- As long as there is 1:1 redemption and confidence in the issuer, market makers will naturally arbitrage the stablecoin to maintain its liquidity balance and peg stability. If there is low arbitrage activity, the issuer could intervene directly itself through open market operations instead of waiting for market makers to perform arbitrage.
- Strong secondary market liquidity enables larger capital entry and exit as well as reduces peg deviation and slippage, improving money elasticity and velocity for the stablecoin across market cycles.
4.5. Stablecoin M2 & M3
- Today, most lending protocols operate onchain money markets that offer short-term, revolving credit (e.g., Aave). Stablecoins are commonly supplied into these markets, where borrowers can take out loans and pay interest to lenders. However, lenders can only withdraw stablecoins that are idle. Borrowed stablecoins (deposit liabilities) must be repaid before lenders can withdraw.
- Stablecoin money market interest rate models in DeFi are typically determined by demand (debt) relative to supply (deposits), or credit utilization (debt / deposits). Higher utilization = higher rates; lower utilization = lower rates.
- When utilization rises and withdrawals become constrained, interest rates increase dynamically, incentivizing borrowers to repay. This self-balancing mechanism eventually restores liquidity and enables lender withdrawals.
- To ensure lender solvency, stablecoin loans in DeFi are usually over-collateralized by assets from borrowers. When a borrower’s position reaches a pre-specified liquidation threshold, their collateral is quickly sold to repay debt and restore liquidity for lenders.
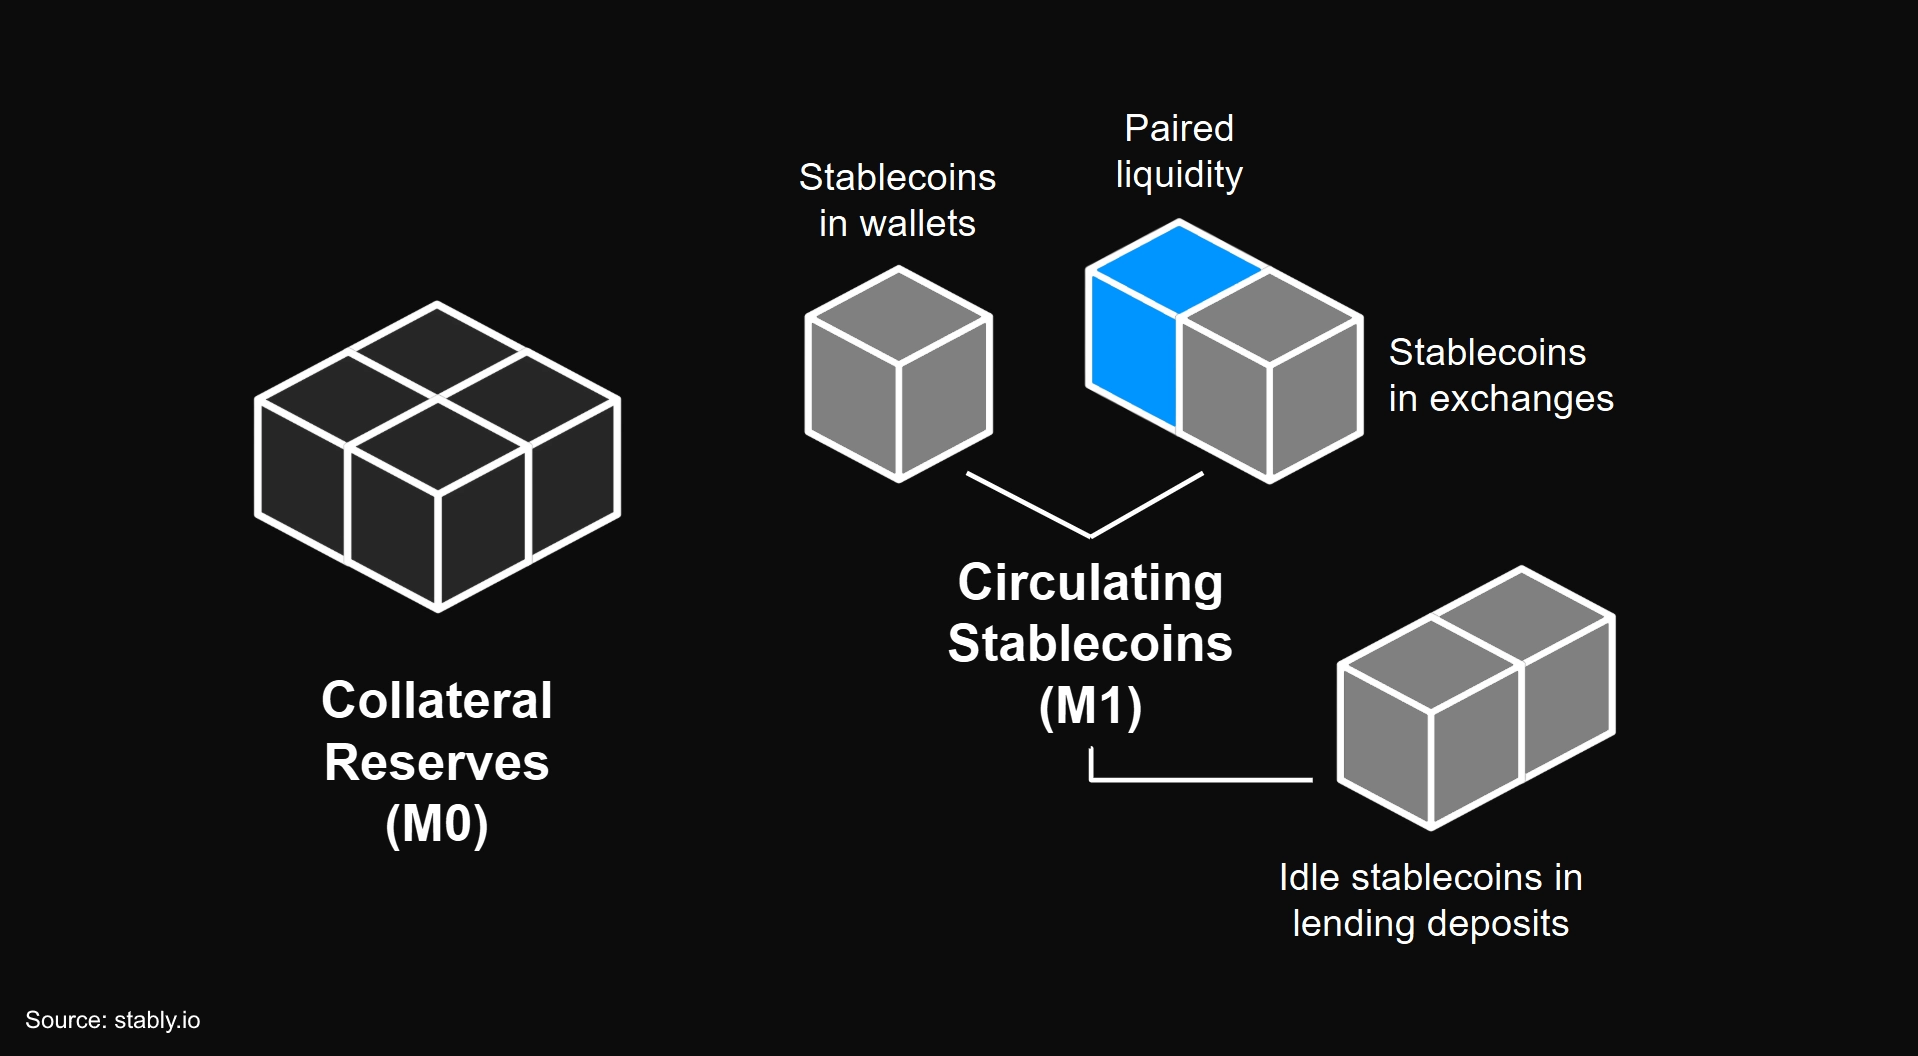
- Debts in money markets increase the stablecoin’s near money supply (M2), which comprises of stablecoins in circulation, including idle deposits in lending platforms, plus near-liquid deposits that have been lent out and are not immediately withdrawable until borrowers repay.
- M2 includes M1 within its definition because lent deposits are still claims on the stablecoin’s circulating supply, even after it has been borrowed.
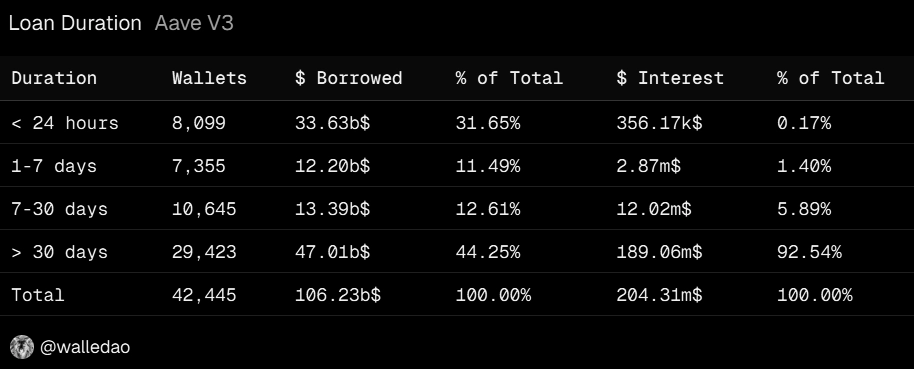
- Traditional near money instruments typically mature in <2 years, but stablecoin money market deposits don't have fixed maturity dates because they operate as open-ended revolving credit facilities. However, their average loan duration tends to be short due to frequent borrower repayments. On Aave, 56% of loans have an average duration of <30 days.
- Deposits are rarely lent out 100% since interest rates rise sharply at high utilization. When this happens, borrowers are naturally incentivized to reduce debt. As a result, a portion of deposits typically remains idle, allowing stablecoin money markets in DeFi to behave like near money under normal market conditions.
- Small stablecoin deposit liabilities with <$100K and <2 years maturity are considered part of the stablecoin’s M2 supply, which includes M1 plus money market and term deposits in CeFi/DeFi as well as staked or locked tokens in general across wallets and smart contracts.
- Large stablecoin deposit liabilities with >$100K and <2 years maturity are considered part of the stablecoin’s M3 supply, which includes M2 plus similar but larger liabilities that may be less liquid than near money.
Aave Loan Duration Statistics
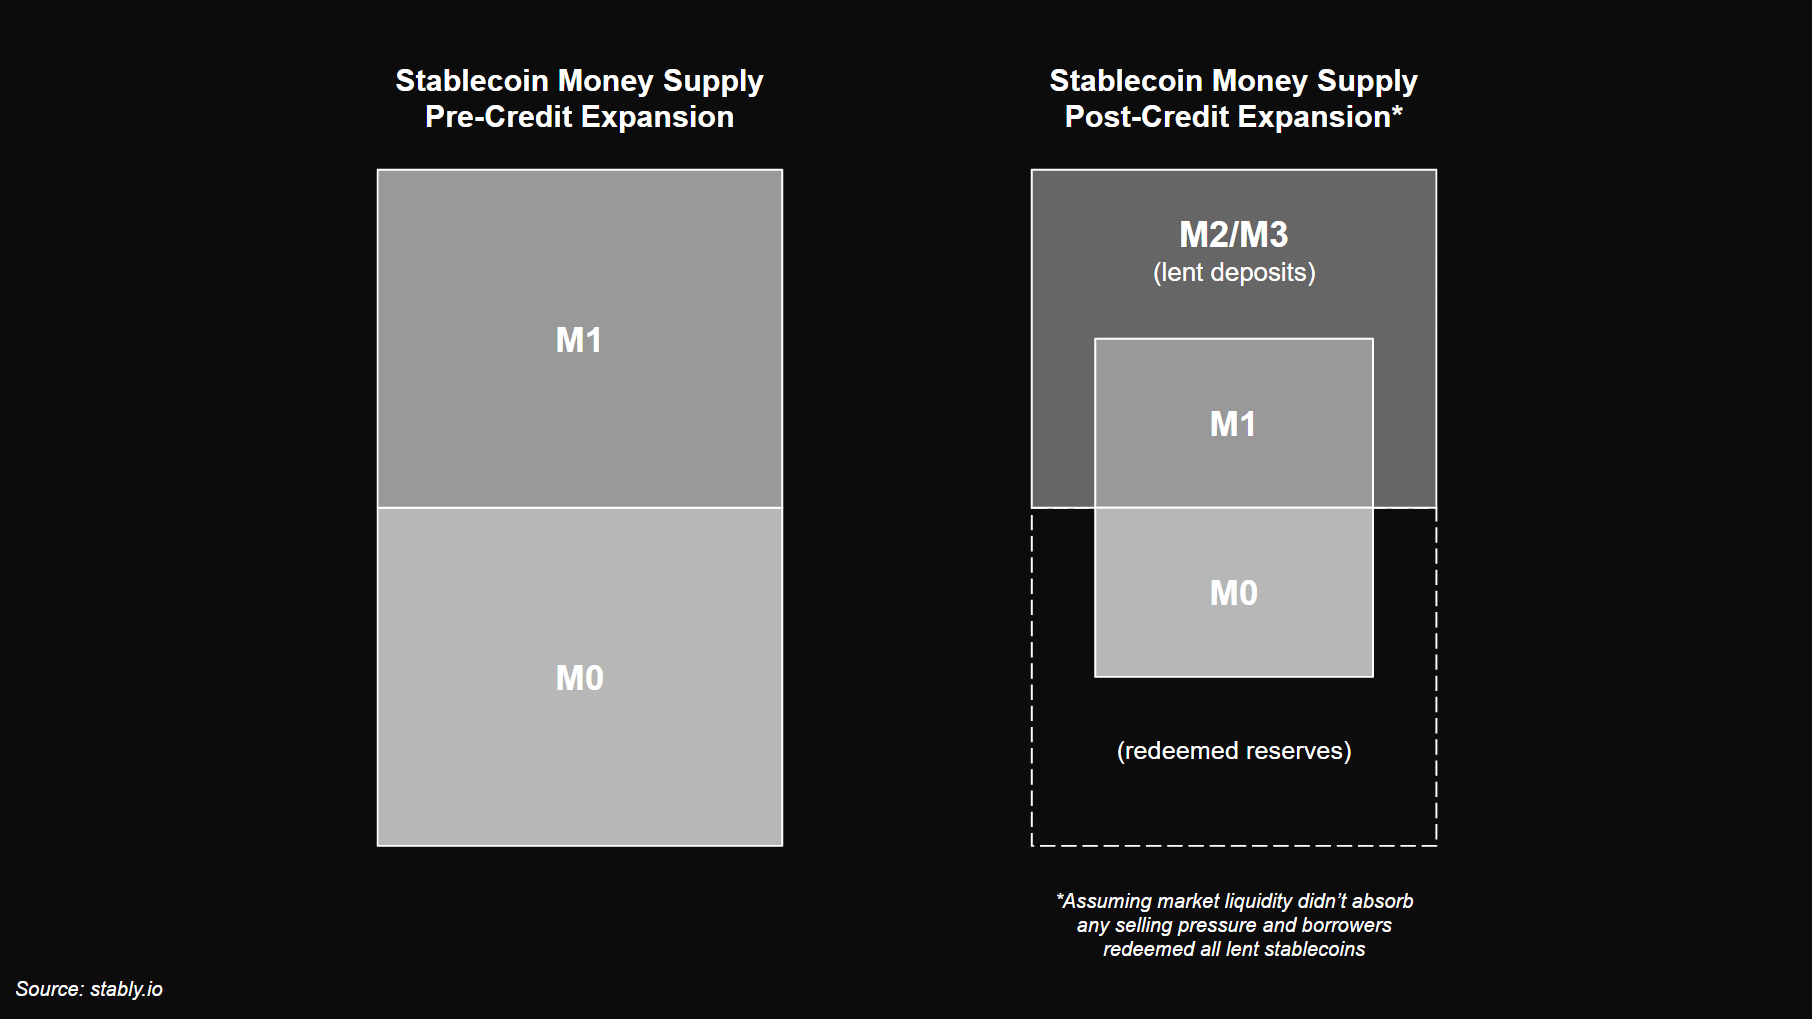
- When a reserve-backed stablecoin is borrowed, it may end up getting redeemed, either directly by borrowers or indirectly by market makers who had exchanged with borrowers.
- As a result, credit expansion ultimately contracts the stablecoin’s M0/M1 supply when there is insufficient secondary market liquidity to absorb selling pressures from borrowers.
- Eventually, when borrowers de-leverage, they have to buy back or mint new stablecoins to repay their debt. This naturally reintroduces base reserves and circulating supply back into the system. As a result, credit contraction re-expands the stablecoin’s M0/M1 supply.
- When sufficient secondary market liquidity exists, credit expansion may not contract M0/M1. Paired liquidity for the stablecoin can expand across exchanges, allowing market makers and liquidity providers to absorb selling from borrowers and reduce redemption pressures.
- Credit velocity (borrows + repays) increases the token’s trading volume and money velocity as borrowers sell stablecoins to leverage, then buy them back later to unwind debt and de-leverage. This generates potential earnings for market makers and liquidity providers over time through trading fees and/or arbitrage profits.
- If market makers and liquidity providers earn sufficient returns, they are incentivized to keep capital deployed. The presence of additional secondary market liquidity from these participants may add net growth to the stablecoin’s total money supply, even during credit expansion cycles.
4.6. Stablecoin Re-Lending
- Users may re-lend borrowed stablecoins in the short term for various reasons, such as “farming” DeFi incentives or keeping idle liquidity productive while preserving capital mobility. Credit expansion from borrower-driven re-lending does not immediately create selling or redemption pressures, allowing M2 to expand without contracting M0/M1.
- If users borrow a stablecoin against itself as collateral to re-lend, often in the short term, it is considered recursive lending, where both re-lending and rehypothecation are involved. Recursive lending also expands M2 without immediately contracting M0/M1.
- If users acquire tokens previously sold by borrowers on exchanges and resupply them into lending protocols, it is considered lender-driven re-lending. When these tokens are bought and re-lent, additional credit and M2/M3 deposit liabilities can be created without requiring M0/M1 to expand in parallel.
- Re-lending enables M2/M3 to exceed M0/M1 prior to redemption outflows, creating layered credit claims on the same number of stablecoins in circulation. In the absence of re-lending, the maximum theoretical credit expansion capacity (M3 − M1) is capped at 100% of M1 (prior to redemptions). With re-lending, effective credit expansion may exceed that threshold.
- Ultimately, re-lent deposits are borrowed by users who require actual liquidity, which can lead to M0/M1 contraction through redemptions. However, because these borrowers must eventually buy back or mint new tokens to repay their debt, M0/M1 can re-expand during credit contraction cycles.
- Borrower-driven re-lending and recursive lending don’t typically create net growth in the stablecoin’s M0/M1 supply during credit contraction cycles because borrowers can simply repay debt with the same deposits they are already holding, as long as those tokens were not borrowed and redeemed out of the system.
- On the other hand, lender-driven re-lending transforms debt repayments into new base reserves and circulating supply during credit contraction cycles because repayment requires borrowers to buy back or mint new tokens, thereby re-expanding M0/M1 rather than merely netting out existing deposit liabilities. If lenders continue deploying capital after borrowers have de-leveraged, re-lending can result in net M0/M1 growth over the full credit cycle.
Re-lending by itself is different than rehypothecation. Re-lending in this context refers to the same stablecoin being borrowed and re-deposited—or borrowed, sold, repurchased, and then re-deposited—thereby creating additional deposit liabilities. Rehypothecation, by contrast, involves the reuse of pledged collateral to secure new borrowing or expand credit supply.
4.7. Stablecoin Meta-Money Supply
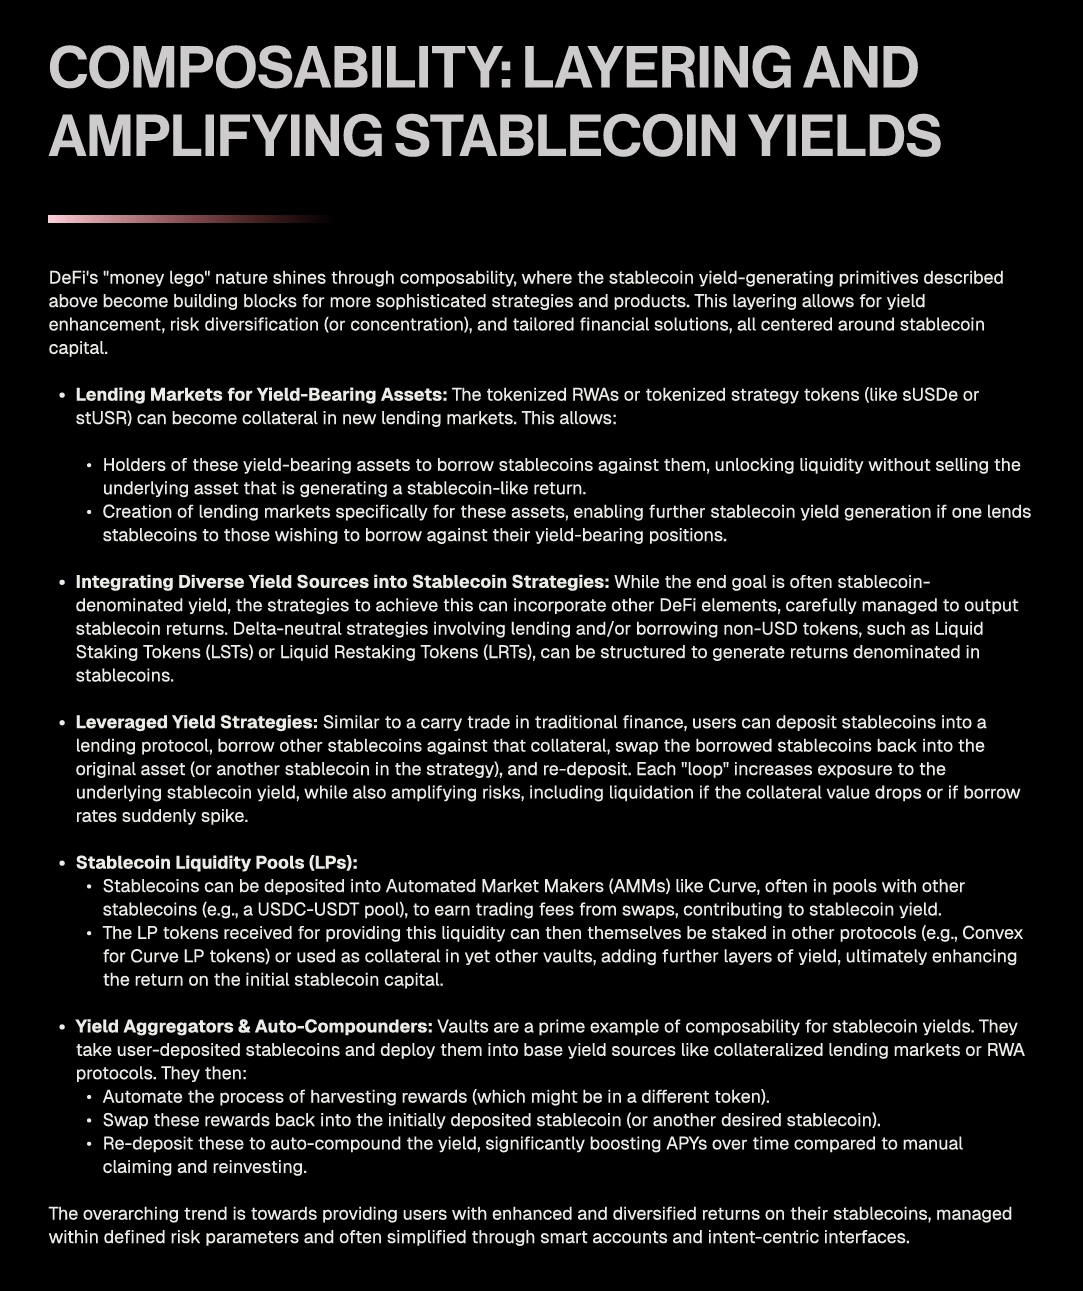
a. DeFi Composability
In DeFi, composability allows tokens and protocols to be combined permissionlessly as modular financial primitives, or “money legos,” synthesizing new products and applications that may unlock additional capital efficiency, yield, and liquidity. However, this interconnectivity also increases systemic risk as failures in one layer can quickly propagate across dependent systems.
To enable composability, many DeFi protocols produce receipt tokens or derivative tokens to function as redeemable shares of user deposits. For example:
- Cross-chain bridges mint wrapped or bridged tokens representing claims on tokens such as stablecoins that are locked on another blockchain. The bridged token enables a derivative of the stablecoin to circulate on the destination chain while maintaining redeemability for the underlying asset held in bridge custody.
- Stablecoin liquidity pools in DEXs produce LP tokens. The LP token represents a claim on one unit of liquidity, composed of the stablecoin and another paired asset(s). Holders can redeem the LP token to withdraw either asset that is available in the pool.
- ERC-4626 vaults can tokenize stablecoin deposits in onchain money markets, allowing lenders to mint yieldcoins. The yieldcoin represents a claim on one unit of lending supply. It is effectively backed by both utilized credit and idle stablecoins in the lending protocol, where loans are secured by collateral from borrowers. Holders can redeem the yieldcoin for underlying stablecoins in these money markets, subject to available liquidity.
- Receipt tokens can also be supplied into other DeFi protocols to create additional layers of derivatives. For example, yieldcoins can be supplied as liquidity in Pendle, the world’s largest decentralized interest rate marketplace, to enable yield trading or hedging via PTs (principal tokens) and YTs (yield tokens).
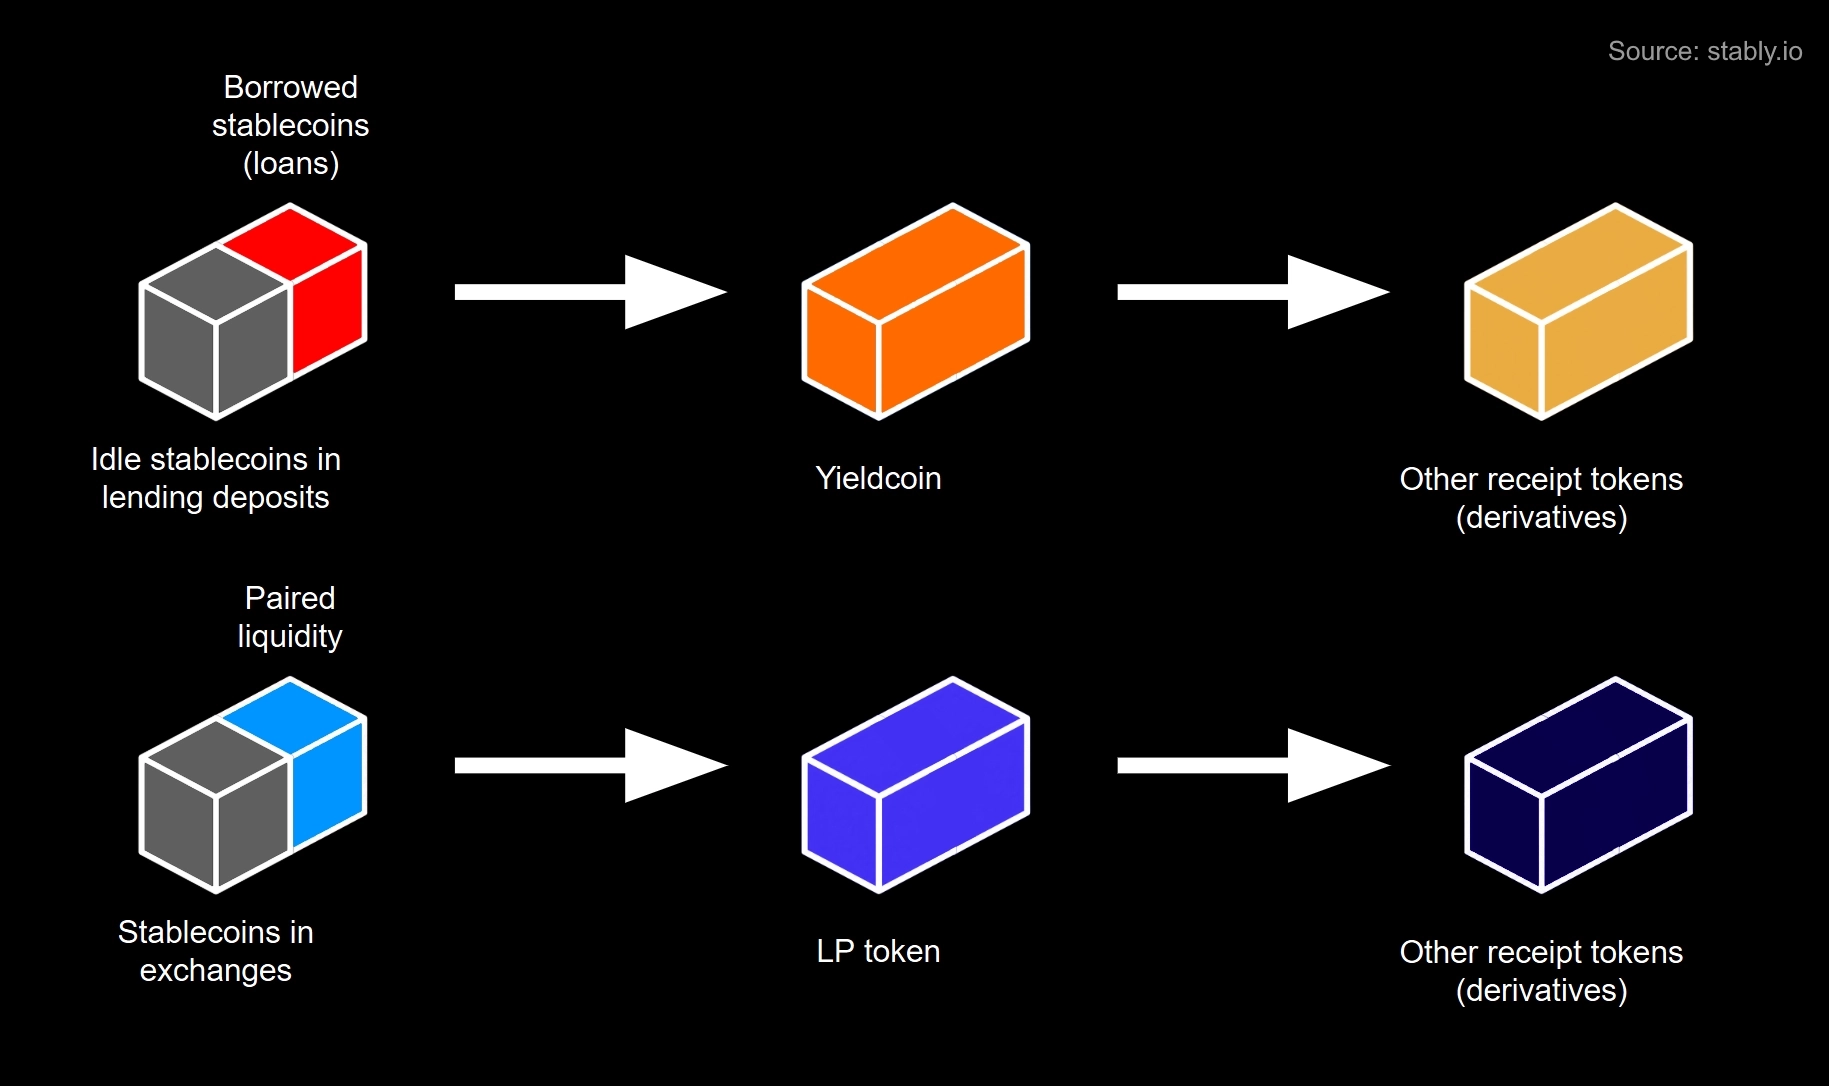
Yieldcoins typically carry a single-asset denomination tied directly to one stablecoin and its deposit liabilities, whereas LP tokens are multi-asset claims on DEX deposits that are redeemable for either a stablecoin or another paired asset(s), subject to available liquidity.
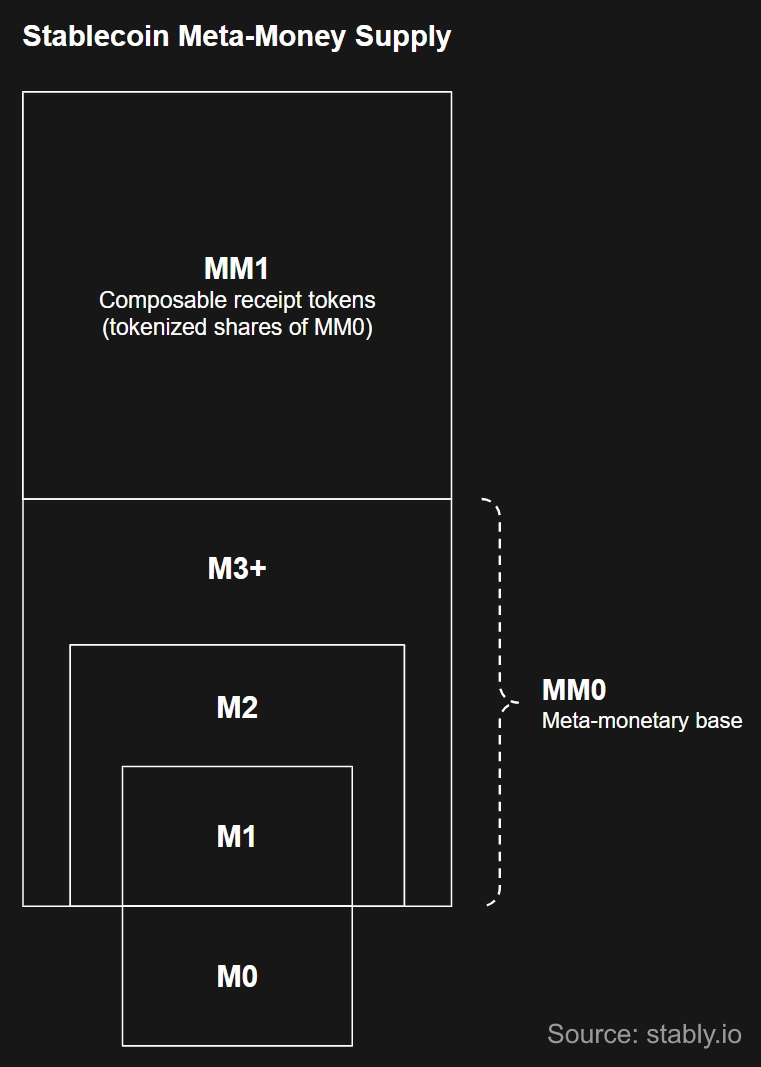
b. Layered Liabilities
Receipt tokens form the meta-narrow money supply (MM1) of reserve-backed stablecoins. MM1 represents tokenized M1/M2/M3 claims that are directly redeemable for underlying tokens or deposit liabilities, subject to available liquidity.
Just as M0 constitutes a reserve-backed stablecoin’s reserve base, its M1/M2/M3 collectively form the meta-reserve base (MM0) of receipt tokens.
Credit markets for receipt tokens may also emerge, creating higher-order deposit liabilities that form the meta-near and meta-broad money supply (MM2/MM3), similar to M2/M3.
However, for MM1 assets to function as effective mediums of credit with high velocity, they need to be non-yield-bearing. Because many receipt tokens (excluding bridged tokens) auto-embed yield, they are more likely to be used as collateral for borrowing, exchange liquidity, or simply for savings—not as lending liquidity, since borrowers tend to avoid loans that are denominated in yield-bearing assets.
To enable credit activity, some DeFi protocols “wrap” or tokenize yield-bearing MM1 assets from external systems into secondary-order stablecoins that do not embed yield, effectively transforming the original MM1 assets into a new M0² reserve base that supports a distinct M1² token liability structure. The underlying yield (float income) can then be redistributed into M2² or M3² deposits associated with the M1² stablecoin. Additionally, M2²/M3² deposits may themselves issue receipt tokens, forming an MM1² layer that can function as M0³ base reserves for M1³ stablecoins with their own M2³/M3³ deposit layers. This recursive structure can continue across additional layers, creating increasingly abstracted monetary hierarchies within DeFi.
Although reserve-backed stablecoins operate under a full-reserve framework with limited native capacity for credit expansion compared to fractional-reserve banking, onchain composability reintroduces leverage through layered financial engineering. Through receipt tokens, onchain derivatives, rehypothecation, and recursive wrapping across protocols, DeFi infrastructure allows secondary and higher-order credit claims to emerge on top of fully reserved base assets. This allows effective credit supply in the system to expand, producing leverage dynamics that may resemble fractional-reserve systems.
c. Systemic Risk
Naturally, these additional layers of financial engineering introduce significant structural complexity, leverage, and systemic risk. Because DeFi is composable, interoperable, and permissionless, instability in the meta layers can rapidly propagate downward, especially if receipt and derivative tokens are used recursively as reserves or collateral for liabilities within M1/M2/M3.
Additionally, the coexistence of multiple stablecoins with different issuers, reserve structures, liquidity conditions, and redemption mechanisms—combined with composability across protocols, bridges, and derivatives—can weaken the effective singleness of money observed in traditional fiat systems, where different forms of money (bank deposits, reserves, and cash) remain fungible and interchangeable at par within a unified monetary hierarchy. In contrast, DeFi ecosystems contain numerous stablecoins with heterogeneous risk profiles, liquidity, and market structures. As these assets interact across composable protocols, fragmentation can emerge across what would traditionally function as a single monetary unit.
The scale of systemic and contagion risks from inter-protocol dependencies has been repeatedly documented throughout DeFi’s history, where impacts from incidents in higher-order layers quickly spread into lower-order ecosystems. For example:
- UST, Terra’s algorithmic stablecoin, depended heavily on reflexive arbitrage incentives and secondary market liquidity on exchanges to maintain peg stability. When confidence collapsed in May 2022, liquidity withdrawals drained UST pools and accelerated its collapse. While UST was not backed by other stablecoins, it was paired extensively with them across liquidity pools. This resulted in stress throughout the market, contributing to a temporary de-peg of USDT to $0.94 during the crisis. Numerous other protocols, funds, and leveraged strategies that integrated with the Terra ecosystem also unraveled, resulting in more than $40 billion in combined market value being wiped out within days.
- Stream Finance was a yieldcoin protocol that issued xUSD, a structured yieldcoin layered on top of underlying stablecoin liquidity and leveraged strategies. In November 2025, xUSD collapsed following revelations of $93 million in losses involving an external fund manager. The disclosure triggered a rapid loss of confidence, freezing of protocol activity, depegging of xUSD, and cascading liquidations across DeFi. The contagion was particularly severe on chains where xUSD held dominant market share, such as Sonic network, where xUSD accounted for more than half of the local yieldcoin supply. This led to widespread user losses and ecosystem failures, including second-order stablecoins that were directly exposed and third-order protocols with indirect exposure to xUSD on Sonic.
As composability and interoperability continue to deepen across DeFi, future stress events may exert direct redemption, liquidity, or confidence pressures on foundational stablecoin systems in ways not yet observed at scale. Because higher-order claims and receipt tokens are often layered recursively across protocols, instability at one level can transmit across integrated systems. Effective risk management therefore require monitoring ecosystems for both the core monetary aggregates and the broader meta-money supply to properly assess systemic exposure.
Lastly, since the meta-money supply represents secondary and higher-order claims layered on top of lower-order token/deposit liabilities, it should not be incorporated into the core monetary aggregates of a reserve-backed stablecoin, which consist of primary token liabilities and their associated deposit liabilities. Nonetheless, it carries material macroeconomic significance, as the meta-money supply can materially influence monetary conditions as well as systemic dynamics in the onchain economy and, increasingly, the real-world economy.
5. dUSD Economics
5.1. Overview
Productivity and credit are two of the most important drivers of economic growth. In real-world economies, productivity arises from technological innovation and improvements in capital efficiency, while credit enables capital formation and demand expansion.
In DeFi, productivity similarly emerges from onchain technology and programmable capital efficiency, which increase the velocity and composability of digital assets like stablecoins. Real yield generation reflects this productivity when it is generated by sustainable economic activity such as trading fees, credit spreads, and liquidity provision. Because a large share of onchain activity is mediated by stablecoins, short-term credit expansion and contraction cycles around stablecoin liquidity play a central role in shaping capital efficiency and yield dynamics within DeFi.
- Credit Expansion: Stablecoin lending and liquidity provision increase as credit demand rises and capital becomes more accessible. This leads to higher utilization, money velocity, and yield generation for users.
- Credit Contraction: De-leveraging reduces debt, liquidity, and utilization as credit demand weakens and capital becomes less accessible. This lowers money velocity and yields until more credit demand or capital enters the system.
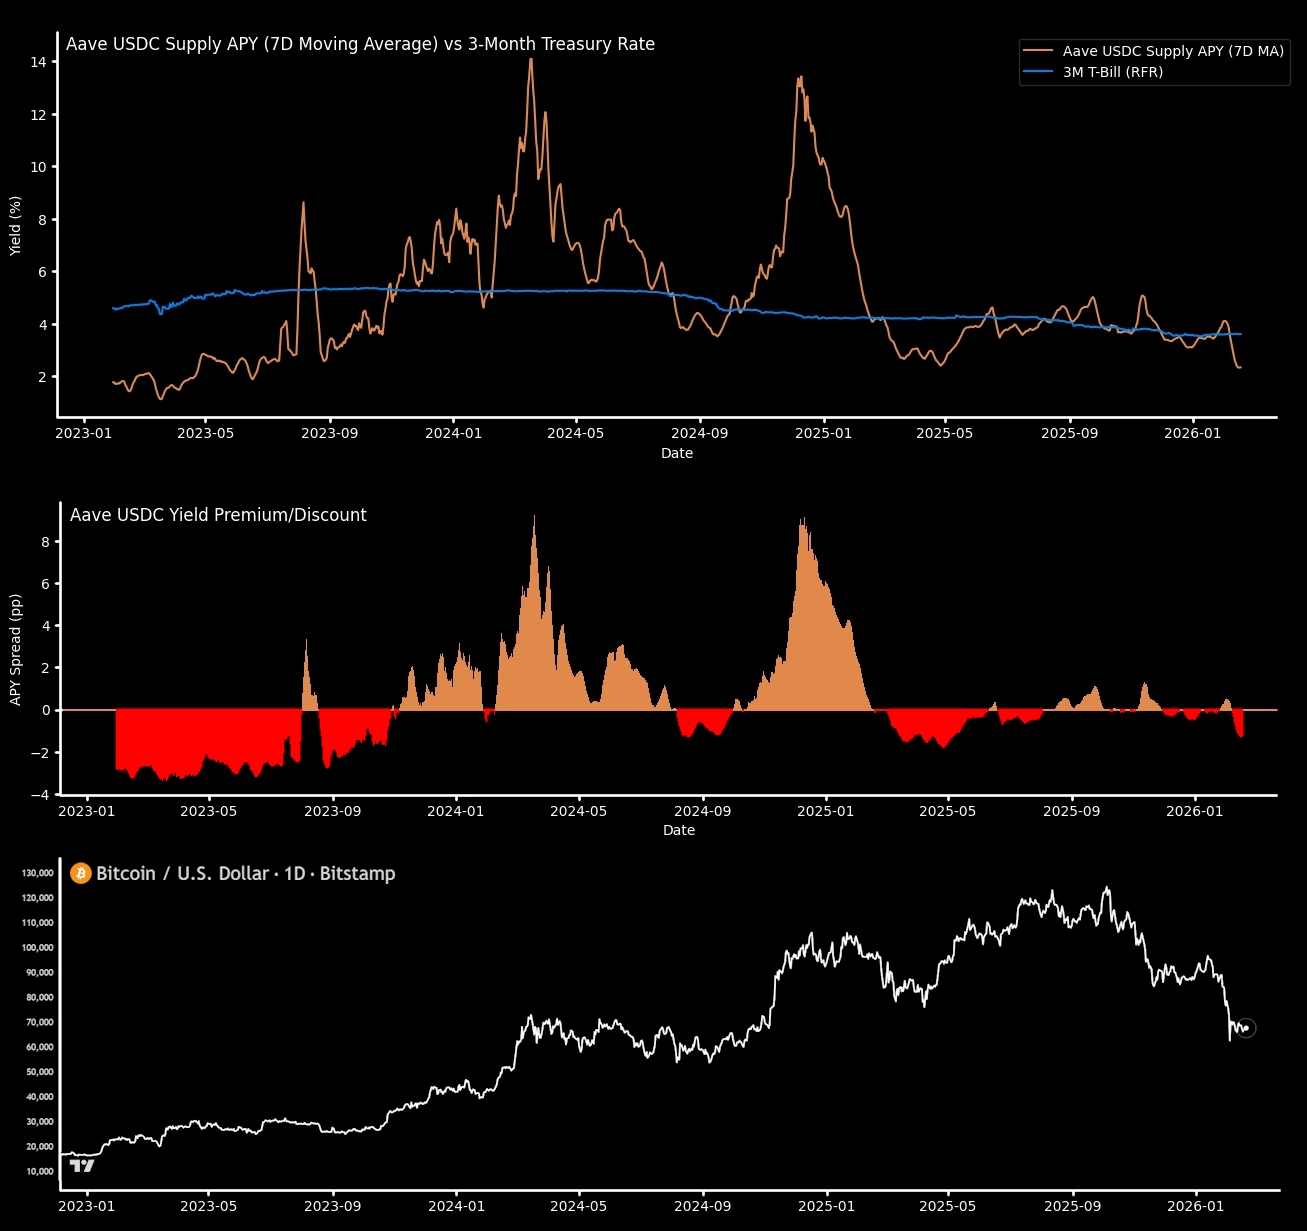
At the moment, stablecoin credit cycles are still largely driven by crypto market cycles, where demand for leverage and liquidity is often tethered to BTC prices. As stablecoin adoption continues to grow in the mainstream economy, onchain credit demand should gradually become more tied to real-world economic activity, such as payments, trade finance, and consumer credit, making stablecoin credit cycles more sustainable and less dependent on speculative market conditions.
Real-world interest rates and central bank policies may also influence stablecoin credit markets and interest rates, often inversely. Generally speaking, a lower risk-free rate (RFR) tends to boost stablecoin yields, while a higher RFR tends to depress stablecoin yields.
- Lower RFR = Higher Stablecoin Yields: When fiat interest rates are low, yields on traditional assets also decline, pushing capital to seek higher returns from DeFi. Additionally, fiat credit expansion during low interest rate environments may drive more capital into onchain markets, raising crypto asset prices and stablecoin credit demand, which leads to higher yields in DeFi.
- Higher RFR = Lower Stablecoin Yields: When fiat interest rates rise, traditional yields become more attractive vs. onchain opportunities. Additionally, fiat credit contraction during high interest rate environments tends to rotate capital back into TradFi which reduces liquidity, weakens crypto asset prices, and lowers stablecoin credit demand, compressing DeFi yields.
When the average yield of stablecoins exceeds the RFR (yield premium), it may signal stronger short-term economic growth and productivity in DeFi vs. TradFi. Conversely, when the average yield of stablecoins falls below the RFR (yield discount), it may indicate slower onchain growth and productivity compared to traditional markets in the short term.
Stablecoin vs. T-Bill Yield Premium/Discount
Simialrly, the dTRINITY economy is also driven by natural credit expansion and contraction cycles of dUSD:
- In expansionary phases, increased leverage and velocity boost credit supply but dilute borrower subsidies, raising effective borrowing and lending rates.
- During contractions, deleveraging activity replenishes reserves and subsidies, lowering effective rates while preparing the system for its next expansionary phase.
5.2. Market Participants
A reserve-backed stablecoin’s credit economy has 4 main types of market participants:
- Lenders are users who mint/buy the stablecoin and supply it into lending protocols to earn yield passively. Their deposits are necessary to extend credit in DeFi’s current pre-funded lending environment. As a result, lenders are core drivers of the stablecoin’s M0/M1 and M2/M3 money supply.
- Borrowers are users who supply collateral into lending protocols to borrow stablecoins at competitive rates. Many are also carry traders (loopers) who use leverage to amplify interest rate arbitrage opportunities. Borrowers help expand the stablecoin’s M2 money supply but they may contract M0/M1 at the same time.
- Liquidity providers (LPs) and market makers (MMs) are users who mint/buy the stablecoin and deploy it on exchanges alongside other paired assets to earn a share of trading fees and capture bid-ask spreads. Both have high capital mobility, but LPs tend to be more passive and rely on AMMs for their strategies. Meanwhile, institutional MMs actively manage their positions on orderbook exchanges, typically with delta-neutral hedges. Thanks to their ongoing liquidity support, LPs and MMs help the stablecoin expand its M0/M1 supply more durably by reducing redemption pressures while enabling large-scale capital entry and exit.
- Arbitrageurs are users who support peg stability by arbitraging the stablecoin when it trades at a discount or premium. They prefer fast execution speed and high capital efficiency, often leveraging flash loans and MEV bots to trade onchain without using their own funds. Arbitrageurs help expand M0/M1 when they mint new stablecoins to sell, but also contract it when they buy back tokens to redeem. In the long run, arbitrageurs have a net-neutral impact on the stablecoin’s supply, but they reinforce market confidence by eliminating price inefficiencies and improving overall liquidity.
Lenders | Borrowers | LPs & MMs | Arbitrageurs | |
Motivations | Lending yield
Capital preservation
Capital productivity
Passively managed | Leverage or liquidity
Speculation or hedging
Carry trading (looping)
Capital efficiency
Actively managed | Fees & spreads
Capital mobility
Capital productivity
Delta neutrality (MMs)
Active (MMs)
Passive (LPs) | Price discount/premium
Execution speed
Capital efficiency
Actively managed |
Key Risks
(Non-Exhaustive) | Stablecoin risk
Credit risk
Liquidity risk
Market risk
Security risk | Leverage risk
Collateral risk
Liquidation risk
Interest rate risk
Market risk
Security risk | Stablecoin risk
Paired asset risk
Impermanent loss risk
Hedging risk
Execution risk
Market risk
Security risk | Stablecoin risk
Execution risk
Market risk
Security risk |
Ecosystem Benefits | ↑ Base reserves
↑ Circulating supply
↑ Credit supply
↑ Float interest
↑ Fee generation | ↑ Utilization & debt
↑ Collateral supply
↑ Credit velocity
↑ Money velocity
↑ Yield generation
↑ Fee generation | ↑ Base reserves
↑ Circulating supply
↑ Market liquidity
↑ Peg stability
↑ Money velocity
↑ Fee generation | ↑ Market liquidity
↑ Peg stability
↑ Money velocity
↑ Fee generation |
For additional risks, please refer to the Risk Disclaimer.
5.3. Peg Dynamics
dUSD is soft-pegged to $1 in the secondary market, supported by arbitrageurs and market makers who rely on permissionless minting/redemption to access 1:1 reserve convertibility.
- Credit Expansion Cycles: Selling pressure from borrowers may cause dUSD to trade below $1, as liquidity pools accumulate more dUSD relative to other paired assets. Market makers are then naturally incentivized to buy dUSD at a discount, redeem it at par, and capture arbitrage profits. This process restores price stability but also decreases reserves at the same time.
- Credit Contraction Cycles: Borrowers mint or buy back dUSD to repay debts, causing dUSD to trade closer to $1 as liquidity pools rebalance. If buying pressure from borrowers causes dUSD to trade above $1, market makers are naturally incentivized to mint dUSD at par, sell it at a premium, and capture arbitrage profits. This process maintains price stability and re-expands underlying reserves.

For more details, please refer to dUSD.
5.4. Interest Rate Dynamics
By subsidizing borrowing costs with float revenue-funded rebates, dTRINITY shifts the demand curve upward across integrated lending markets for dUSD, structurally increasing credit demand even at higher gross interest rates. This moves the market toward a new equilibrium that unlocks greater utilization and yields. Borrowers are able to pay lenders more in gross interest while still benefiting from competitive net borrowing costs after subsidies, creating a win-win dynamic for both sides of the market.
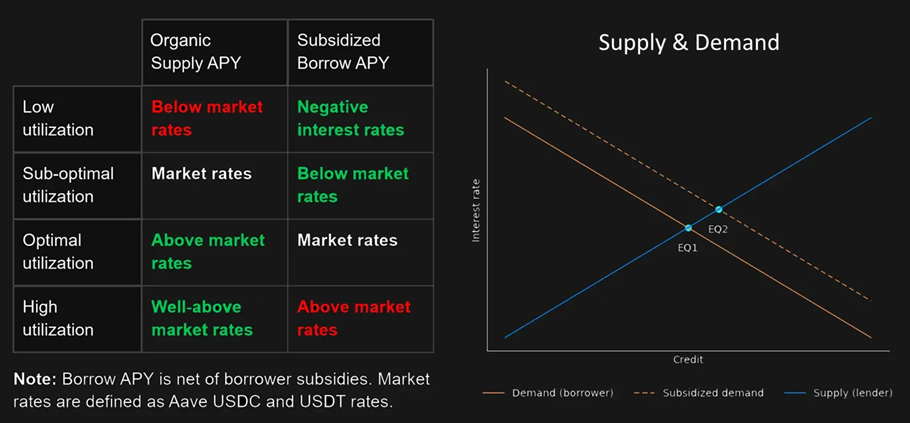
Even as float revenue declines during low-yield or contractionary periods, reduced subsidies still deliver materially better outcomes vs. no subsidies. The resulting increase in borrower participation and utilization unlocks a higher long-run equilibrium for dUSD, where lenders earn above-average yields while borrowers maintain below-average net costs across market cycles.

For more details, please refer to dLEND.
5.5. Market Cycle Dynamics
Bull Market → Credit Expansion → Rising Rates
- Leverage Demand: Rising asset prices and low dUSD borrowing costs increase monetary leverage, driving lending deposits and debts higher, expanding the M2 supply of dUSD.
- Increased Utilization: Growing debt pushes up utilization, tightening system-wide credit.
- Increased Velocity: Borrowers and arbitrageurs increase credit velocity and money velocity of dUSD across the entire market.
- Yields Rise: Higher utilization and velocity increase yields for lenders and LPs of dUSD.
- Credit Expansion: Higher yields attract more capital into the system, increasing the M0/M1 and M2 supply of dUSD.
- Reserve Contraction: Debt expansion and arbitrage activity raise the redemption rate of dUSD, reducing the M0/M1 supply at the same time.
- Subsidy Dilution: A higher debt-to-reserve ratio and lower float revenue reduce rebates per unit of debt, compressing dUSD borrower subsidies.
- Borrowing Costs Rise: Lower rebates raise dUSD net borrowing rates.
Bear Market → Credit Contraction → Falling Rates
- Deleverage Demand: Falling asset prices and high dUSD borrowing costs reduce monetary leverage, driving lending deposits and debts lower, contracting the M2 supply of dUSD.
- Decreased Utilization: Debt unwinds pull down utilization, loosening system-wide credit.
- Decreased Velocity: Lower debt and reduced activity decrease credit velocity and money velocity of dUSD across the entire market.
- Yields Fall: Lower utilization and velocity reduce yields for lenders and LPs of dUSD.
- Credit Contraction: Lower yields lead to capital outflows from the system, decreasing the M0/M1 and M2 supply of dUSD.
- Reserve Expansion: Debt repayments and arbitrage activity lower the redemption rate of dUSD, re-expanding the M0/M1 supply at the same time.
- Subsidy Regeneration: A lower debt-to-reserve ratio and higher float revenue increase rebates per unit of debt, boosting dUSD borrower subsidies.
- Borrowing Costs Fall: Higher rebates reduce dUSD net borrowing rates.
- Repeat from Step 1 ☯️
6. Key Metrics
6.1. Overview
The metrics below are key performance indicators of the dTRINITY economy. They provide a unified framework for understanding how value flows through the system: from base reserves, stablecoin issuance, and credit expansion, to market liquidity, money velocity, and protocol revenue. Due to dTRINITY’s chain-isolated architecture, these metrics are calculated on a per network basis, where Ethereum is expected to dominate most protocol economic activity.
6.2. Monetary Metrics
Description | Significance | |
Reserve TVL (M0) | Exogenous collateral backing of dUSD, including stablecoins, yieldcoins, and Curve LP positions | Total reserve base of dUSD, serving as final settlement money for redemptions while anchoring price stability to the underlying base reserves; analogous to the M0 money supply in TradFi. |
Circulating Supply (M1) | Total Mints - Total Redeems
(including dUSD in AMOs) | Total supply of dUSD tokens in circulation, fully backed by base reserves. This represents the narrow money supply, i.e., spendable/transferable dUSD used for transactions and liquidity across the entire market; analogous to M1 in TradFi. |
Broad Money Supply (M2) | M1 + Aggregate Debt | dUSD broad money supply, i.e., narrow money + credit expansion through lending activity; analogous to M2 in TradFi. |
Redemption Rate | Total Redeems / Total Mints | Average rate of demand for dUSD base reserves. |
Money Velocity | Total Daily Transfers / (M1 - dUSD in AMOs) | Transactional velocity of organic dUSD across the entire market where tokens transfer between wallets or accounts (on/offchain), including P2P transfers, swaps/trades, staking, lending, borrowing, etc. |
Reserve Ratio | M0 / M1 | Also known as the “Collateral Ratio,” or the current level of collateralization for dUSD, which should be at least 100%. |
Money Multiplier Ratio | M2 / (M1 - dUSD in AMOs) | AMO + credit amplification factor of dUSD’s organic monetary base; analogous to the money multiplier ratio in TradFi. |
Monetary Leverage Ratio | Aggregate Debt / M2 | The share of dUSD’s total money supply actively deployed as credit across the entire market. |
Debt-to-Reserve Ratio
(Debt Ratio) | Aggregate Debt / (M0 - dUSD in AMOs) | dUSD debt expansion relative to its organic reserve base. This ratio helps determine how much float revenue can be distributed as borrower rebates per unit of debt. |
Lending-to-Reserve Ratio
(Lending Ratio) | Aggregate Lending TVL / (M0 - dUSD in AMOs) | dUSD credit supply relative to its organic reserve base. This ratio helps determine how much float revenue can be distributed as lender rewards per unit of TVL.
Note: dTRINITY rebates borrowers by default. Some float revenue may be shared with lenders as rewards, depending on market conditions. |
Liquidity-to-Reserve Ratio
(Liquidity Ratio) | Aggregate Liquidity TVL / (M0 - dUSD in AMOs) | dUSD + sdUSD secondary market liquidity relative to the organic reserve base. This ratio helps determine how much float revenue can be distributed as LP rewards per unit of TVL.
Note: Some float revenue may also be shared with LPs as rewards, depending on market conditions. |
Float APY | (Float Revenue - Retained Float Revenue) / (M0 - dUSD in AMOs) | Exogenous yield (float revenue) generated from reserves provides the core source of funding for dUSD user incentives, minus any protocol retentions. |
Borrower Rebate APY | (Float APY / Debt Ratio) × Market Weight | Variable interest rebate rate for dUSD borrowers per market by weight, reducing their net cost per unit of debt. |
Lender Reward APY | (Float APY / Lending Ratio) × Market Weight | Variable supply reward rate for dUSD lenders per market by weight, enhancing their net yield per unit of TVL. |
LP Reward APY | (Float APY / Liquidity Ratio) × Market Weight | Variable supply reward rate for dUSD and/or sdUSD LPs per market by weight, enhancing their net yield per unit of TVL. |
6.3. Liquidity Metrics
Description | Significance | |
Peg Stability | Average deviations from unit NAV (net asset value) for dUSD + sdUSD | Primary indicator of stability and credibility for dTRINITY. Peg stability is reinforced by open market operations and atomic redemptions of protocol-issued assets. |
Aggregate Liquidity TVL | Total assets deposited into all integrated trading pairs and liquidity pools for dUSD + sdUSD | Measure of total liquidity depth for protocol-issued assets across the entire market.
Note: dUSD + sdUSD pools are both included since cross-pool arbitrage activity mutually supports liquidity and peg stability for both assets. |
Aggregate Liquidity Composition | Percentage of dUSD + sdUSD vs. other paired assets across all integrated trading pairs and liquidity pools | Deep liquidity from paired assets strengthen peg stability for protocol-issued assets, vice versa. |
Aggregate Trading Volume | Total daily volume across all integrated trading pairs and liquidity pools for dUSD + sdUSD | A core component of money velocity for protocol-issued assets across the entire market. |
Aggregate Liquidity Utilization | Aggregate Trading Volume / Aggregate Liquidity TVL | Measure of capital efficiency for liquidity pools of protocol-issued assets across the entire market. |
Aggregate Base LP APY | Average LP earnings rate from trading fees + native yields via paired assets across all integrated trading pairs and liquidity pools for dUSD + sdUSD | Variable baseline yield for LPs of protocol-issued assets across the entire market (before rewards). |
Aggregate Net LP APY | Aggregate Base LP APY + LP Reward APY | Effective average yield for LPs of protocol-issued assets across the entire market (net of rewards).
Note: Rewards may be distributed directly to LPs or processed through veTokenomic mechanisms (e.g., Curve’s veCRV), potentially improving reward efficiency and LP returns. |
6.4. Credit Metrics
a. dLEND Markets Only
Description | Significance | |
Vault TVL | Total assets in native lending vaults (e.g., sdUSD). These vaults are also powered by dLEND | dTRINITY’s ERC-4626 strategy vaults mint redeemable receipt tokens that enable composability and secondary market liquidity potential for dLEND deposits. |
Lending TVL | dUSD supplied by lenders and vaults into dLEND | Total dUSD credit supply within the dTRINITY protocol, enabling endogenous debt expansion. |
Debt | Active dUSD loans in dLEND | Total dUSD debt within the dTRINITY protocol; cannot be greater than Lending TVL. |
Collateral TVL | Collateral supplied by borrowers into dLEND | Total collateral securing dUSD debts within the dTRINITY protocol (separate from dUSD base reserves).
Note: dUSD is disabled as collateral in dLEND to prevent subsidy arbitrage by loopers. |
Credit Utilization | Debt / Lending TVL | dUSD credit utilization level within the dTRINITY protocol. |
LTV Ratio
(Loan-to-Value) | Debt / Collateral TVL | Primary indicator of average health and credit risk for dUSD loans within the dTRINITY protocol. |
Leverage Ratio | Debt / (Collateral TVL - Debt) | Average level of leverage taken on by dUSD borrowers within the dTRINITY protocol. |
Credit Velocity | (Total Borrows + Total Repayments) / Average Debt | Average turnover rate of dUSD credit within the dTRINITY protocol. |
Gross Borrow APY | dUSD borrowing rate determined by dLEND’s dynamic interest rate model and utilization | Variable raw borrowing cost for dUSD in dLEND (before rebates); cannot be less than Base Supply APY. |
Net Borrow APY | Gross Borrow APY - Borrower Rebate APY | Effective borrowing cost for dUSD in dLEND (net of rebates); may be less than Base Supply APY. |
Base Supply APY | dUSD lending rate determined by dLEND’s dynamic interest rate model and utilization | Variable raw lending yield for dUSD in dLEND (before rewards); cannot be greater than Gross Borrow APY. |
Net Supply APY | Base Supply APY + Reward APY | Effective lending yield for dUSD in dLEND (net of rewards); may be greater than Gross Borrow APY. |
b. All Lending Markets
Description | Significance | |
Aggregate Lending TVL | dLEND Lending TVL + dUSD deposits in all externally integrated lending markets (e.g., Morpho) | Total dUSD credit supply across the entire market. |
Aggregate Debt | dLEND Debt + all external lending markets | Total dUSD debt across the entire market; cannot be greater than Aggregate Lending TVL. |
Aggregate Collateral TVL | dLEND Collateral TVL + collateral deposits in all externally integrated dUSD lending markets | Total collateral securing dUSD debt across the entire market (separate from dUSD base reserves).
Note: dUSD is disabled as collateral across all integrated lending markets to prevent subsidy arbitrage by loopers. |
Aggregate Credit Utilization | Aggregate Debt / Aggregate Lending TVL | Average dUSD credit utilization level across the entire market. |
Aggregate LTV Ratio | Aggregate Debt / Aggregate Collateral TVL | Primary indicator of average health and credit risk for dUSD loans across the entire market. |
Aggregate Leverage Ratio | Aggregate Debt / (Aggregate Collateral TVL - Aggregate Debt) | Average level of leverage taken on by dUSD borrowers across the entire market. |
Aggregate Credit Velocity | (Total Borrows + Total Repayments) / Average Aggregate Debt | Average turnover rate of dUSD credit across the entire market. |
Aggregate Gross Borrow APY | Average dUSD borrowing rate determined by different interest rate models and utilization levels across integrated lending markets | Raw average borrowing cost for dUSD across the entire market (before rebates); cannot be less than Aggregate Base Supply APY. |
Aggregate Net Borrow APY | Aggregate Gross Borrow APY - Borrower Rebate APY | Effective average borrowing cost for dUSD across the entire market (net of rebates); may be less than Aggregate Base Supply APY. |
Aggregate Base Supply APY | Average dUSD lending rate determined by different interest rate models and utilization levels across integrated lending markets | Raw average lending yield for dUSD across the entire market (before rewards); cannot be greater than Aggregate Gross Borrow APY. |
Aggregate Net Supply APY | Aggregate Base Supply APY + Reward APY | Effective average lending yield for dUSD across the entire market (net of rewards); may be greater than Aggregate Gross Borrow APY. |
6.5. Protocol Metrics
Description | Significance | |
Protocol TVL | Reserve TVL + Lending TVL + Collateral TVL + Vault TVL | Total value locked within the dTRINITY protocol. |
Aggregate TVL | Reserve TVL + Vault TVL + Aggregate Lending TVL + Aggregate Collateral TVL + Aggregate Liquidity TVL + Others | Total value locked globally across all integrated markets for protocol-issued assets. |
Total Users | Total holders + lenders + borrowers + vault depositors + LPs + other users of protocol-issued assets | Protocol adoption headcount across the entire market. |
Average User TVL | Aggregate TVL / Total Users | Average capital deployed per user across the entire market. |
Total Revenue | Float revenue + dUSD fees + dLEND fees + vault fees + others | Total protocol revenue generated by dTRINITY across all sources. |
Gross Income | Total Revenue - COGS | COGS include interest rebates, protocol emissions, liquidity incentives, etc. |
Gross Income-to-Reserve | Gross Income / Reserve TVL | dTRINITY’s gross income relative to base reserves. |
Gross Income-to-TVL | Gross Income / Protocol TVL | dTRINITY’s gross income relative to Protocol TVL. |
Live analytics dashboard coming soon.